[
{
"name": "Visualization.Axis",
"comment": " The axis component renders human-readable reference marks for scales. This\nalleviates one of the more tedious tasks in visualizing data.\n\n@docs axis, defaultOptions, Options, Orientation, RenderableScale\n\n",
"unions": [
{
"name": "Orientation",
"comment": " ",
"args": [],
"cases": [
[
"Left",
[]
],
[
"Right",
[]
],
[
"Top",
[]
],
[
"Bottom",
[]
]
]
}
],
"aliases": [
{
"name": "Options",
"comment": " Options for configuring the scale:\n\n - `orientation`: Where to render the Axis.\n - `ticks`: Optionally pass ticks (in the domain). Defaults to `Scale.ticks`.\n - `tickFormat`: A formatting function for the tick marks. Defaults to `Scale.tickFormat`.\n - `tickCount`: How many tickmarks to approximately generate. Defaults to 10.\n\n",
"args": [
"a"
],
"type": "{ orientation : Orientation, ticks : Maybe (List a), tickFormat : Maybe (a -> String), tickCount : Int, tickSizeInner : Float, tickSizeOuter : Float, tickPadding : Float }"
},
{
"name": "RenderableScale",
"comment": " A type alias for the scale. Currently only continuous (including time) and band (via the `toRenderable` function) scales are supported.\n",
"args": [
"a",
"domain",
"range",
"value"
],
"type": "Scale { a | ticks : domain -> Int -> List value, domain : domain, tickFormat : domain -> Int -> value -> String, convert : domain -> range -> value -> Float, range : range, rangeExtent : domain -> range -> ( Float, Float ) }"
}
],
"values": [
{
"name": "axis",
"comment": " Renders an Axis based on a [Scale](Visualization-Scale).\n\n view =\n svg []\n [ g [class \"axis\", transform \"translate(0, 300)\"]\n [ Axis.axis Axis.defaultOptions myScale\n ]\n [\n\nRegardless of orientation, axes are always rendered at the origin. To change the\nposition of the axis with respect to the chart, specify a transform attribute on\nthe containing element.\n\nThe elements created by the axis are considered part of its public API.\nYou can apply external stylesheets to\ncustomize the axis appearance. An axis consists of a path element of class\n“domain” representing the extent of the scale’s domain, followed by transformed\ng elements of class “tick” representing each of the scale’s ticks. Each tick has\na line element to draw the tick line, and a text element for the tick label.\nFor example, here is a typical bottom-oriented axis:\n\n \n \n \n \n 0.0\n \n \n \n 0.2\n \n \n \n 0.4\n \n \n \n 0.6\n \n \n \n 0.8\n \n \n \n 1.0\n \n \n\n",
"type": "Options value -> RenderableScale a domain range value -> Svg msg"
},
{
"name": "defaultOptions",
"comment": " Default options to use\n",
"type": "Options a"
}
],
"binops": []
},
{
"name": "Visualization.Scale",
"comment": " Scales are a convenient abstraction for a fundamental task in visualization:\nmapping a dimension of abstract data to a visual representation. Although most\noften used for position-encoding quantitative data, such as mapping a measurement\nin meters to a position in pixels for dots in a scatterplot, scales can represent\nvirtually any visual encoding, such as diverging colors, stroke widths, or symbol\nsize. Scales can also be used with virtually any type of data, such as named\ncategorical data or discrete data that requires sensible breaks.\n\nFor continuous quantitative data, you typically want a linear scale. (For time\nseries data, a time scale.) If the distribution calls for it, consider\ntransforming data using a power or log scale. A quantize scale may aid\ndifferentiation by rounding continuous data to a fixed set of discrete values;\nsimilarly, a quantile scale computes quantiles from a sample population, and a\nthreshold scale allows you to specify arbitrary breaks in continuous data.\nSeveral built-in sequential color schemes are also provided.\n\nFor discrete ordinal (ordered) or categorical (unordered) data, an ordinal scale\nspecifies an explicit mapping from a set of data values to a corresponding set\nof visual attributes (such as colors). The related band and point scales are\nuseful for position-encoding ordinal data, such as bars in a bar chart or dots\nin an categorical scatterplot. Several built-in categorical color scales are\nalso provided.\n\nScales have no intrinsic visual representation. However, most scales can generate\nand format ticks for reference marks to aid in the construction of [axes](Visualization-Axis).\n\n\n# General notes\n\n@docs Scale\n\n\n# Continuous Scales\n\n@docs ContinuousScale, linear, log, identity, ContinuousTimeScale, time\n\nContinuous scales support the following operations:\n\n@docs convert, invert, domain, range, rangeExtent, ticks, tickFormat, clamp, nice\n\n\n# Sequential Scales\n\nSequential scales are similar to continuous scales in that they map a continuous,\nnumeric input domain to a continuous output range. However, unlike continuous\nscales, the output range of a sequential scale is fixed by its interpolator function.\n\n@docs SequentialScale, sequential\n\nSequential scales support the following operations:\n\n@docs convert, domain, rangeExtent\n\n\n### Interpolator functions\n\nHere are a few pre-built interpolator functions you can use with sequential scales:\n\n@docs viridisInterpolator, infernoInterpolator, magmaInterpolator, plasmaInterpolator\n\n\n# Quantize Scales\n\nQuantize scales are similar to linear scales, except they use a discrete rather\nthan continuous range. The continuous input domain is divided into uniform\nsegments based on the number of values in (i.e., the cardinality of) the output\nrange. Each range value y can be expressed as a quantized linear function of the\ndomain value `x`: `y = m round(x) + b`.\n\n@docs QuantizeScale, quantize\n\nQuantize scales support the following operations:\n\n@docs convert, invertExtent, domain, range, rangeExtent, ticks, tickFormat, nice\n\n\n# Ordinal Scales\n\nUnlike continuous scales, ordinal scales have a discrete domain and range. For\nexample, an ordinal scale might map a set of named categories to a set of colors,\nor determine the horizontal positions of columns in a column chart.\n\n@docs OrdinalScale, ordinal\n\nOrdinal scales support the following operations:\n\n@docs convert\n\nNote that convert returns a Maybe for Ordinal scales. It is up to you to handle\npotentially missing values in the domain.\n\n@docs domain, range\n\nHere are a few color schemes that you can use with ordinal scales to\nsupport categorical data:\n\n@docs category10, category20a, category20b, category20c\n\n\n# Band Scales\n\nBand scales are like ordinal scales except the output range is continuous and\nnumeric. Discrete output values are automatically computed by the scale by\ndividing the continuous range into uniform bands. Band scales are typically used\nfor bar charts with an ordinal or categorical dimension.\n\n@docs BandScale, band, BandConfig, defaultBandConfig\n\nBand scales support the following operations:\n\n@docs convert, domain, range, bandwidth, toRenderable\n\n",
"unions": [
{
"name": "Scale",
"comment": " This API is highly polymorphic as each scale has different functions exposed.\nThis is still done in a convenient and type-safe manner, however the cost is\na certain ugliness and complexity of the type signatures. For this reason the\nsupported functions are listed again for each category. It is best to ignore the\ntype signatures when learning about the library.\n",
"args": [
"scaleSpec"
],
"cases": []
}
],
"aliases": [
{
"name": "BandConfig",
"comment": " Configuration options for deciding how bands are partioned,\n\n\n### `.paddingInner : Float`\n\nThe inner padding determines the ratio (so the value must be in\nthe range [0, 1]) of the range that is reserved for blank space\nbetween bands.\n\n\n### `.paddingOuter : Float`\n\nThe outer padding determines the ratio (so the value must be in\nthe range [0, 1]) of the range that is reserved for blank space\nbefore the first band and after the last band.\n\n\n### `.align : Float`\n\nThe alignment determines how any leftover unused space in the range\nis distributed. A value of 0.5 indicates that the leftover space\nshould be equally distributed before the first band and after the last\nband; i.e., the bands should be centered within the range. A value\nof 0 or 1 may be used to shift the bands to one side, say to position\nthem adjacent to an axis.\n\n",
"args": [],
"type": "{ paddingInner : Float, paddingOuter : Float, align : Float }"
},
{
"name": "BandScale",
"comment": " Type alias for a band scale. These transform an arbitrary `List a`\nto a continous (Float, Float) by uniformely partitioning the range.\n",
"args": [
"a"
],
"type": "Scale { domain : List a, range : ( Float, Float ), convert : List a -> ( Float, Float ) -> a -> Float, bandwidth : Float }"
},
{
"name": "ContinuousScale",
"comment": " Type alias for Continuous Scales. These map a `(Float, Float)` **domain** to a\n`(Float, Float)` **range**.\n",
"args": [],
"type": "Scale { domain : ( Float, Float ), range : ( Float, Float ), convert : ( Float, Float ) -> ( Float, Float ) -> Float -> Float, invert : ( Float, Float ) -> ( Float, Float ) -> Float -> Float, ticks : ( Float, Float ) -> Int -> List Float, tickFormat : ( Float, Float ) -> Int -> Float -> String, nice : ( Float, Float ) -> Int -> ( Float, Float ), rangeExtent : ( Float, Float ) -> ( Float, Float ) -> ( Float, Float ) }"
},
{
"name": "ContinuousTimeScale",
"comment": " This is identical to a ContinuousScale, except the domain values are Dates instead of Floats.\n",
"args": [],
"type": "Scale { domain : ( Date, Date ), range : ( Float, Float ), convert : ( Date, Date ) -> ( Float, Float ) -> Date -> Float, invert : ( Date, Date ) -> ( Float, Float ) -> Float -> Date, ticks : ( Date, Date ) -> Int -> List Date, tickFormat : ( Date, Date ) -> Int -> Date -> String, nice : ( Date, Date ) -> Int -> ( Date, Date ), rangeExtent : ( Date, Date ) -> ( Float, Float ) -> ( Float, Float ) }"
},
{
"name": "OrdinalScale",
"comment": " Type alias for ordinal scales. These transform an arbitrary\n`List a` domain to an arbitrary list `List b`, where the mapping\nis based on order.\n",
"args": [
"a",
"b"
],
"type": "Scale { domain : List a, range : List b, convert : List a -> List b -> a -> Maybe b }"
},
{
"name": "QuantizeScale",
"comment": " Type alias for quantize scales. These transform a `(Float, Float)` domain\nto an arbitrary non-empty list `(a, List a)`.\n",
"args": [
"a"
],
"type": "Scale { domain : ( Float, Float ), range : ( a, List a ), convert : ( Float, Float ) -> ( a, List a ) -> Float -> a, invertExtent : ( Float, Float ) -> ( a, List a ) -> a -> Maybe ( Float, Float ), ticks : ( Float, Float ) -> ( a, List a ) -> Int -> List Float, tickFormat : ( Float, Float ) -> ( a, List a ) -> Int -> Float -> String, nice : ( Float, Float ) -> Int -> ( Float, Float ), rangeExtent : ( Float, Float ) -> ( a, List a ) -> ( a, a ) }"
},
{
"name": "SequentialScale",
"comment": " Type alias for sequential scales. This transforms a continuous `(Float, Float)`\ndomain to an arbitrary range `a` defined by the interpolator function `Float -> a`.\n",
"args": [
"a"
],
"type": "Scale { domain : ( Float, Float ), range : Float -> a, convert : ( Float, Float ) -> (Float -> a) -> Float -> a }"
}
],
"values": [
{
"name": "band",
"comment": " Constructs a band scale.\n",
"type": "BandConfig -> List a -> ( Float, Float ) -> BandScale a"
},
{
"name": "bandwidth",
"comment": " Returns the width of a band in a band scale.\n\n scale : BandScale String\n scale = band defaultBandConfig [\"a\", \"b\", \"c\"] (0, 120)\n\n bandwidth scale --> 40\n\n",
"type": "Scale { scale | bandwidth : Float } -> Float"
},
{
"name": "category10",
"comment": " \n\nA list of ten categorical colors\n\n",
"type": "List Color"
},
{
"name": "category20a",
"comment": " \n\nA list of twenty categorical colors\n\n",
"type": "List Color"
},
{
"name": "category20b",
"comment": " \n\nA list of twenty categorical colors\n\n",
"type": "List Color"
},
{
"name": "category20c",
"comment": " \n\nA list of twenty categorical colors. This color scale includes color\nspecifications and designs developed by Cynthia Brewer (colorbrewer2.org).\n\n",
"type": "List Color"
},
{
"name": "clamp",
"comment": " Enables clamping on the domain, meaning the return value of the scale is\nalways within the scale’s range.\n\n scale : ContinuousScale\n scale = linear ( 10, 100 ) ( 50, 100 )\n convert scale 1 --> 45\n\n convert (clamp scale) 1 --> 50\n\n",
"type": "Scale { a | convert : ( Float, Float ) -> range -> Float -> result } -> Scale { a | convert : ( Float, Float ) -> range -> Float -> result }"
},
{
"name": "convert",
"comment": " Given a value from the domain, returns the corresponding value from the range.\nIf the given value is outside the domain the mapping may be extrapolated such\nthat the returned value is outside the range.\n",
"type": "Scale { a | convert : domain -> range -> value -> result, domain : domain, range : range } -> value -> result"
},
{
"name": "defaultBandConfig",
"comment": " Creates some reasonable defaults for a BandConfig:\n\n defaultBandConfig --> { paddingInner = 0.0, paddingOuter = 0.0, align = 0.5 }\n\n",
"type": "BandConfig"
},
{
"name": "domain",
"comment": " Retrieve the domain of the scale.\n",
"type": "Scale { a | domain : domain } -> domain"
},
{
"name": "identity",
"comment": " Identity scales are a special case of linear scales where the domain and\nrange are identical; the scale and its invert method are thus the identity function.\nThese scales are occasionally useful when working with pixel coordinates, say in\nconjunction with an axis or brush.\n",
"type": "ContinuousScale"
},
{
"name": "infernoInterpolator",
"comment": " \n\nGiven a number t in the range [0,1], returns the corresponding\ncolor from the “inferno” perceptually-uniform color scheme designed\nby [van der Walt, Smith and Firing](https://bids.github.io/colormap/)\nfor matplotlib, represented as a core Color value.\n\n",
"type": "Float -> Color"
},
{
"name": "invert",
"comment": " Given a value from the range, returns the corresponding value from the domain.\nInversion is useful for interaction, say to determine the data value corresponding\nto the position of the mouse.\n",
"type": "Scale { a | invert : domain -> range -> value -> result, domain : domain, range : range } -> value -> result"
},
{
"name": "invertExtent",
"comment": " Returns the extent of values in the domain for the corresponding value in the\nrange. This method is useful for interaction, say to determine the value in the\ndomain that corresponds to the pixel location under the mouse.\n",
"type": "Scale { a | invertExtent : domain -> range -> value -> Maybe ( comparable, comparable ), domain : domain, range : range } -> value -> Maybe ( comparable, comparable )"
},
{
"name": "linear",
"comment": " Linear scales are a good default choice for continuous quantitative data\nbecause they preserve proportional differences. Each range value y can be\nexpressed as a function of the domain value x: y = mx + b.\n\n scale : ContinuousScale\n scale = linear ( 0, 1 ) ( 50, 100 )\n convert scale 0.5 --> 75\n\n",
"type": "( Float, Float ) -> ( Float, Float ) -> ContinuousScale"
},
{
"name": "log",
"comment": " Log scales are similar to linear scales, except a logarithmic transform is\napplied to the input domain value before the output range value is computed.\nThe mapping to the range value y can be expressed as a function of the domain\nvalue x: y = m log(x) + b.\n\nAs log(0) = -∞, a log scale domain must be strictly-positive or strictly-negative;\nthe domain must not include or cross zero. A log scale with a positive domain has\na well-defined behavior for positive values, and a log scale with a negative\ndomain has a well-defined behavior for negative values. (For a negative domain,\ninput and output values are implicitly multiplied by -1.) The behavior of the\nscale is undefined if you pass a negative value to a log scale with a positive\ndomain or vice versa.\n\nThe arguments are `base`, `domain` and `range`.\n\n scale : ContinuousScale\n scale = log 10 ( 10, 1000 ) ( 50, 100 )\n convert scale 100 --> 75\n\n",
"type": "Float -> ( Float, Float ) -> ( Float, Float ) -> ContinuousScale"
},
{
"name": "magmaInterpolator",
"comment": " \n\nGiven a number t in the range [0,1], returns the corresponding\ncolor from the “magma” perceptually-uniform color scheme designed\nby [van der Walt, Smith and Firing](https://bids.github.io/colormap/)\nfor matplotlib, represented as a core Color value.\n\n",
"type": "Float -> Color"
},
{
"name": "nice",
"comment": " Returns a new scale which extends the domain so that it lands on round values.\nThe second argument is the same as you would pass to ticks.\n\n scale : ContinuousScale\n scale = linear ( 0.5, 99 ) ( 50, 100 )\n domain (nice scale 10) --> (0, 100)\n\n",
"type": "Scale { a | nice : domain -> Int -> domain, domain : domain } -> Int -> Scale { a | nice : domain -> Int -> domain, domain : domain }"
},
{
"name": "ordinal",
"comment": " Constructs an ordinal scale.\n",
"type": "List a -> List b -> OrdinalScale a b"
},
{
"name": "plasmaInterpolator",
"comment": " \n\nGiven a number t in the range [0,1], returns the corresponding\ncolor from the “plasma” perceptually-uniform color scheme designed\nby [van der Walt, Smith and Firing](https://bids.github.io/colormap/)\nfor matplotlib, represented as a core Color value.\n\n",
"type": "Float -> Color"
},
{
"name": "quantize",
"comment": " Constructs a new quantize scale. The range for these is a\nnon-empty list represented as a `(head, tail)` tuple.\n",
"type": "( Float, Float ) -> ( a, List a ) -> QuantizeScale a"
},
{
"name": "range",
"comment": " Retrieve the range of the scale.\n",
"type": "Scale { a | range : range } -> range"
},
{
"name": "rangeExtent",
"comment": " Retrieve the minimum and maximum elements from the range.\n",
"type": "Scale { a | rangeExtent : domain -> range -> ( b, b ), domain : domain, range : range } -> ( b, b )"
},
{
"name": "sequential",
"comment": " Construct a sequential scale.\n",
"type": "( Float, Float ) -> (Float -> a) -> SequentialScale a"
},
{
"name": "tickFormat",
"comment": " A number format function suitable for displaying a tick value, automatically\ncomputing the appropriate precision based on the fixed interval between tick values.\nThe specified count should have the same value as the count that is used to generate the tick values.\n",
"type": "Scale { a | tickFormat : domain -> Int -> value -> String, domain : domain, convert : domain -> range -> value -> b } -> Int -> value -> String"
},
{
"name": "ticks",
"comment": " The second argument controls approximately how many representative values from\nthe scale’s domain to return. A good default value 10. The returned tick values are uniformly spaced,\nhave human-readable values (such as multiples of powers of 10), and are guaranteed\nto be within the extent of the domain. Ticks are often used to display reference\nlines, or tick marks, in conjunction with the visualized data. The specified count\nis only a hint; the scale may return more or fewer values depending on the domain.\n\n scale : ContinuousScale\n scale = linear ( 10, 100 ) ( 50, 100 )\n ticks scale 10 --> [10, 20, 30, 40, 50, 60, 70, 80, 90, 100]\n\n",
"type": "Scale { a | ticks : domain -> Int -> List ticks, domain : domain } -> Int -> List ticks"
},
{
"name": "time",
"comment": " Time scales are a variant of linear scales that have a temporal domain: domain\nvalues are dates rather than floats, and invert likewise returns a date.\nTime scales implement ticks based on calendar intervals, taking the pain out of\ngenerating axes for temporal domains.\n",
"type": "( Date, Date ) -> ( Float, Float ) -> ContinuousTimeScale"
},
{
"name": "toRenderable",
"comment": " This converts a BandScale into a [RenderableScale](http://package.elm-lang.org/packages/gampleman/elm-visualization/latest/Visualization-Axis#RenderableScale)\nsuitable for rendering Axes. This has the same domain and range, but the convert output is shifted by half a `bandwidth`\nin order for ticks and labels to align nicely.\n",
"type": "BandScale a -> Scale { ticks : List a -> Int -> List a, domain : List a, tickFormat : List a -> Int -> a -> String, convert : List a -> ( Float, Float ) -> a -> Float, range : ( Float, Float ), rangeExtent : List a -> ( Float, Float ) -> ( Float, Float ) }"
},
{
"name": "viridisInterpolator",
"comment": " \n\nGiven a number t in the range [0,1], returns the corresponding\ncolor from the “viridis” perceptually-uniform color scheme designed\nby [van der Walt, Smith and Firing](https://bids.github.io/colormap/)\nfor matplotlib, represented as a core Color value.\n\n",
"type": "Float -> Color"
}
],
"binops": []
},
{
"name": "Visualization.Shape",
"comment": " Visualizations typically consist of discrete graphical marks, such as symbols,\narcs, lines and areas. While the rectangles of a bar chart may be easy enough to\ngenerate directly using SVG or Canvas, other shapes are complex, such as rounded\nannular sectors and centripetal Catmull–Rom splines. This module provides a\nvariety of shape generators for your convenience.\n\n\n# Arcs\n\n[](http://code.gampleman.eu/elm-visualization/PieChart/)\n\n@docs arc, Arc, centroid\n\n\n# Pies\n\n@docs PieConfig, pie, defaultPieConfig\n\n\n# Lines\n\n[](http://code.gampleman.eu/elm-visualization/LineChart/)\n\n@docs line, lineRadial, area, areaRadial\n\n\n# Curves\n\nWhile lines are defined as a sequence of two-dimensional [x, y] points, and areas are similarly\ndefined by a topline and a baseline, there remains the task of transforming this discrete representation\ninto a continuous shape: i.e., how to interpolate between the points. A variety of curves are provided for this purpose.\n\n@docs Curve, linearCurve\n@docs basisCurve, basisCurveClosed, basisCurveOpen\n@docs bundleCurve\n@docs cardinalCurve, cardinalCurveClosed, cardinalCurveOpen\n@docs catmullRomCurve, catmullRomCurveClosed, catmullRomCurveOpen\n@docs monotoneInXCurve, monotoneInYCurve\n@docs stepCurve, naturalCurve\n\n\n# Stack\n\nA stack is a way to fit multiple graphs into one drawing. Rather than drawing graphs on top of each other,\nthe layers are stacked. This is useful when the relation between the graphs is of interest.\n\nIn most cases, the absolute size of a piece of data becomes harder to determine for the reader.\n\n@docs StackConfig, StackResult, stack\n\n\n## Stack Offset\n\nThe method of stacking.\n\n@docs stackOffsetNone , stackOffsetDiverging , stackOffsetExpand , stackOffsetSilhouette , stackOffsetWiggle\n\n\n## Stack Order\n\nThe order of the layers. Normal list functions can be used, for instance\n\n -- keep order of the input data\n identity\n\n -- reverse\n List.reverse\n\n -- decreasing by sum of the values (largest is lowest)\n List.sortBy (Tuple.second >> List.sum >> negate)\n\n@docs sortByInsideOut\n\n",
"unions": [
{
"name": "Curve",
"comment": " A curve is represented as a list of points, which a curve function can turn\ninto drawing commands.\n\n*Note*: The intention is to eventually open this type so that custom curves may\nbe implemented, but I will first implement a number of curves to make sure the\ntype makes sense.\n\n",
"args": [],
"cases": []
}
],
"aliases": [
{
"name": "Arc",
"comment": " Used to configure an `arc`. These can be generated by a `pie`, but you can\neasily modify these later.\n\n\n## innerRadius : Float\n\nUsefull for creating a donut chart. A negative value is treated as zero. If larger\nthan `outerRadius` they are swapped.\n\n\n## outerRadius : Float\n\nThe radius of the arc. A negative value is treated as zero. If smaller\nthan `innerRadius` they are swapped.\n\n\n## cornerRadius : Float\n\nIf the corner radius is greater than zero, the corners of the arc are rounded\nusing circles of the given radius. For a circular sector, the two outer corners\nare rounded; for an annular sector, all four corners are rounded. The corner\ncircles are shown in this diagram:\n\n[](http://code.gampleman.eu/elm-visualization/CornerRadius/)\n\nThe corner radius may not be larger than `(outerRadius - innerRadius) / 2`.\nIn addition, for arcs whose angular span is less than π, the corner radius may\nbe reduced as two adjacent rounded corners intersect. This is occurs more often\nwith the inner corners.\n\n\n## startAngle : Float\n\nThe angle is specified in radians, with 0 at -y (12 o’clock) and positive angles\nproceeding clockwise. If |endAngle - startAngle| ≥ τ, a complete circle or\nannulus is generated rather than a sector.\n\n\n## endAngle : Float\n\nThe angle is specified in radians, with 0 at -y (12 o’clock) and positive angles\nproceeding clockwise. If |endAngle - startAngle| ≥ τ, a complete circle or annulus\nis generated rather than a sector.\n\n\n## padAngle : Float\n\nThe pad angle is converted to a fixed linear distance separating adjacent arcs,\ndefined as padRadius * padAngle. This distance is subtracted equally from the\nstart and end of the arc. If the arc forms a complete circle or annulus,\nas when |endAngle - startAngle| ≥ τ, the pad angle is ignored.\n\nIf the inner radius or angular span is small relative to the pad angle, it may\nnot be possible to maintain parallel edges between adjacent arcs. In this case,\nthe inner edge of the arc may collapse to a point, similar to a circular sector.\nFor this reason, padding is typically only applied to annular sectors\n(i.e., when innerRadius is positive), as shown in this diagram:\n\n[](http://code.gampleman.eu/elm-visualization/PadAngle/)\n\nThe recommended minimum inner radius when using padding is outerRadius * padAngle / sin(θ),\nwhere θ is the angular span of the smallest arc before padding. For example,\nif the outer radius is 200 pixels and the pad angle is 0.02 radians,\na reasonable θ is 0.04 radians, and a reasonable inner radius is 100 pixels.\n\nOften, the pad angle is not set directly on the arc generator, but is instead\ncomputed by the pie generator so as to ensure that the area of padded arcs is\nproportional to their value.\nIf you apply a constant pad angle to the arc generator directly, it tends to\nsubtract disproportionately from smaller arcs, introducing distortion.\n\n\n## padRadius : Float\n\nThe pad radius determines the fixed linear distance separating adjacent arcs,\ndefined as padRadius * padAngle.\n\n",
"args": [],
"type": "{ innerRadius : Float, outerRadius : Float, cornerRadius : Float, startAngle : Float, endAngle : Float, padAngle : Float, padRadius : Float }"
},
{
"name": "PieConfig",
"comment": " Used to configure a `pie` generator function.\n\n`innerRadius`, `outerRadius`, `cornerRadius` and `padRadius` are simply forwarded\nto the `Arc` result. They are provided here simply for convenience.\n\n\n## valueFn : a -> Float\n\nThis is used to compute the actual numerical value used for computing the angles.\nYou may use a `List.map` to preprocess data into numbers instead, but this is\nuseful if trying to use `sortingFn`.\n\n\n## sortingFn : a -> a -> Order\n\nSorts the data. Sorting does not affect the order of the generated arc list,\nwhich is always in the same order as the input data list; it merely affects\nthe computed angles of each arc. The first arc starts at the start angle and the\nlast arc ends at the end angle.\n\n\n## startAngle : Float\n\nThe start angle here means the overall start angle of the pie, i.e., the start\nangle of the first arc. The units of angle are arbitrary, but if you plan to use\nthe pie generator in conjunction with an arc generator, you should specify an\nangle in radians, with 0 at -y (12 o’clock) and positive angles proceeding clockwise.\n\n\n## endAngle : Float\n\nThe end angle here means the overall end angle of the pie, i.e., the end angle\nof the last arc. The units of angle are arbitrary, but if you plan to use the\npie generator in conjunction with an arc generator, you should specify an angle\nin radians, with 0 at -y (12 o’clock) and positive angles proceeding clockwise.\n\nThe value of the end angle is constrained to startAngle ± τ, such that |endAngle - startAngle| ≤ τ.\n\n\n## padAngle : Float\n\nThe pad angle here means the angular separation between each adjacent arc. The\ntotal amount of padding reserved is the specified angle times the number of\nelements in the input data list, and at most |endAngle - startAngle|; the\nremaining space is then divided proportionally by value such that the relative\narea of each arc is preserved.\n\n",
"args": [
"a"
],
"type": "{ startAngle : Float, endAngle : Float, padAngle : Float, sortingFn : a -> a -> Order, valueFn : a -> Float, innerRadius : Float, outerRadius : Float, cornerRadius : Float, padRadius : Float }"
},
{
"name": "StackConfig",
"comment": " Configuration for a stacked chart.\n\n - `data`: List of values with an accompanying label.\n - `offset`: How to stack the layers on top of each other.\n - `order`: sorting function to determine the order of the layers.\n\nSome example configs:\n\n stackedBarChart : StackConfig String\n stackedBarChart =\n { data = myData\n , offset = Shape.stackOffsetNone\n , order =\n -- stylistic choice: largest (by sum of values)\n -- category at the bottom\n List.sortBy (Tuple.second >> List.sum >> negate)\n }\n\n streamgraph : StackConfig String\n streamgraph =\n { data = myData\n , offset = Shape.stackOffsetWiggle\n , order = Shape.sortByInsideOut (Tuple.second >> List.sum)\n }\n\n",
"args": [
"a"
],
"type": "{ data : List ( a, List Float ), offset : List (List ( Float, Float )) -> List (List ( Float, Float )), order : List ( a, List Float ) -> List ( a, List Float ) }"
},
{
"name": "StackResult",
"comment": " The basis for constructing a stacked chart\n\n - `labels`: Sorted list of labels\n - `values`: Sorted list of values, where every item is a `(yLow, yHigh)` pair.\n - `extent`: The minimum and maximum y-value. Convenient for creating scales.\n\n",
"args": [
"a"
],
"type": "{ values : List (List ( Float, Float )), labels : List a, extent : ( Float, Float ) }"
}
],
"values": [
{
"name": "arc",
"comment": " The arc generator produces a [circular](https://en.wikipedia.org/wiki/Circular_sector)\nor [annular] sector, as in\na pie or donut chart. If the difference between the start and end angles (the\nangular span) is greater than [τ][tau],\nthe arc generator will produce a complete circle or annulus. If it is less than\n[τ][tau], arcs may have\nrounded corners and angular padding. Arcs are always centered at ⟨0,0⟩; use a\ntransform to move the arc to a different position.\n\nSee also the pie generator, which computes the necessary angles to represent an\narray of data as a pie or donut chart; these angles can then be passed to an arc\ngenerator.\n\nThis will produce a string suitable to being passed into the `d` attribute of an\nSVG `path` element.\n\n[annular]: https://en.wikipedia.org/wiki/Annulus_(mathematics)\n[tau]: https://en.wikipedia.org/wiki/Turn_(geometry)#Tau_proposal\n\n",
"type": "Arc -> String"
},
{
"name": "area",
"comment": " The area generator produces an area, as in an area chart. An area is defined\nby two bounding lines, either splines or polylines. Typically, the two lines\nshare the same x-values (x0 = x1), differing only in y-value (y0 and y1);\nmost commonly, y0 is defined as a constant representing zero. The first line\n(the topline) is defined by x1 and y1 and is rendered first; the second line\n(the baseline) is defined by x0 and y0 and is rendered second, with the points\nin reverse order. With a `linearCurve` curve, this produces a clockwise polygon.\n\nThe data attribute you pass in should be a `[Just ((x0, y0), (x1, y1))]`. Passing\nin `Nothing` represents gaps in the data and corresponding gaps in the area will\nbe rendered.\n\nUsually you will need to convert your data into a format supported by this function.\nFor example, if your data is a `List (Date, Float)`, you might use something like:\n\n areaGenerator : ( Date, Float ) -> Maybe ( ( Float, Float ), ( Float, Float ) )\n areaGenerator ( x, y ) =\n Just\n ( ( Scale.convert xScale x, Tuple.first (Scale.rangeExtent yScale) )\n , ( Scale.convert xScale x, Scale.convert yScale y )\n )\n\n areaPath : List ( Date, Float ) -> String\n areaPath data =\n List.map areaGenerator data\n |> Shape.area Shape.linearCurve\n\nwhere `xScale` and `yScale` would be appropriate `Scale`s.\n\n",
"type": "(Curve -> List PathSegment) -> List (Maybe ( Point, Point )) -> String"
},
{
"name": "areaRadial",
"comment": " This works exactly like `area`, except it interprets the points it recieves as `(angle, radius)`\npairs, where radius is in *radians*. Therefore it renders a radial layout with a center at `(0, 0)`.\n\nUse a transform to position the layout in final rendering.\n\n",
"type": "(Curve -> List PathSegment) -> List (Maybe ( Point, Point )) -> String"
},
{
"name": "basisCurve",
"comment": " Produces a cubic [basis spline](https://en.wikipedia.org/wiki/B-spline) using the specified control points.\nThe first and last points are triplicated such that the spline starts at the first point and ends at the last\npoint, and is tangent to the line between the first and second points, and to the line between the penultimate\nand last points.\n\n \n\n",
"type": "Curve -> List PathSegment"
},
{
"name": "basisCurveClosed",
"comment": " Produces a closed cubic basis spline using the specified control points. When a line segment ends, the first three control points are repeated, producing a closed loop with C2 continuity.\n\n
 \n\n",
"type": "Curve -> List PathSegment"
},
{
"name": "basisCurveOpen",
"comment": " Produces a cubic basis spline using the specified control points. Unlike basis, the first and last points are not repeated, and thus the curve typically does not intersect these points.\n\n
 \n\n",
"type": "Curve -> List PathSegment"
},
{
"name": "bundleCurve",
"comment": " Produces a straightened cubic [basis spline](https://en.wikipedia.org/wiki/B-spline) using the specified control points,\nwith the spline straightened according to the curve’s beta (a reasonable default is `0.85`). This curve is typically\nused in hierarchical edge bundling to disambiguate connections, as proposed by [Danny Holten](https://www.win.tue.nl/vis1/home/dholten/)\nin [Hierarchical Edge Bundles: Visualization of Adjacency Relations in Hierarchical Data](https://www.win.tue.nl/vis1/home/dholten/papers/bundles_infovis.pdf).\n\nThis curve is not suitable to be used with areas.\n\n
 \n\n",
"type": "Float -> Curve -> List PathSegment"
},
{
"name": "cardinalCurve",
"comment": " Produces a cubic [cardinal spline](https://en.wikipedia.org/wiki/Cubic_Hermite_spline#Cardinal_spline) using\nthe specified control points, with one-sided differences used for the first and last piece.\n\nThe tension parameter determines the length of the tangents: a tension of one yields all zero tangents, equivalent to\n`linearCurve`; a tension of zero produces a uniform Catmull–Rom spline.\n\n
 \n\n",
"type": "Float -> Curve -> List PathSegment"
},
{
"name": "cardinalCurveClosed",
"comment": " Produces a cubic [cardinal spline](https://en.wikipedia.org/wiki/Cubic_Hermite_spline#Cardinal_spline) using\nthe specified control points. At the end, the first three control points are repeated, producing a closed loop.\n\nThe tension parameter determines the length of the tangents: a tension of one yields all zero tangents, equivalent to\n`linearCurve`; a tension of zero produces a uniform Catmull–Rom spline.\n\n
 \n\n",
"type": "Float -> Curve -> List PathSegment"
},
{
"name": "cardinalCurveOpen",
"comment": " Produces a cubic [cardinal spline](https://en.wikipedia.org/wiki/Cubic_Hermite_spline#Cardinal_spline) using\nthe specified control points. Unlike curveCardinal, one-sided differences are not used for the first and last piece, and thus the curve starts at the second point and ends at the penultimate point.\n\nThe tension parameter determines the length of the tangents: a tension of one yields all zero tangents, equivalent to\n`linearCurve`; a tension of zero produces a uniform Catmull–Rom spline.\n\n
 \n\n",
"type": "Float -> Curve -> List PathSegment"
},
{
"name": "catmullRomCurve",
"comment": " Produces a cubic Catmull–Rom spline using the specified control points and the parameter alpha (a good default is 0.5),\nas proposed by Yuksel et al. in [On the Parameterization of Catmull–Rom Curves](http://www.cemyuksel.com/research/catmullrom_param/),\nwith one-sided differences used for the first and last piece.\n\nIf alpha is zero, produces a uniform spline, equivalent to `curveCardinal` with a tension of zero; if alpha is one,\nproduces a chordal spline; if alpha is 0.5, produces a [centripetal spline](https://en.wikipedia.org/wiki/Centripetal_Catmull–Rom_spline).\nCentripetal splines are recommended to avoid self-intersections and overshoot.\n\n
 \n\n",
"type": "Float -> Curve -> List PathSegment"
},
{
"name": "catmullRomCurveClosed",
"comment": " Produces a cubic Catmull–Rom spline using the specified control points and the parameter alpha (a good default is 0.5),\nas proposed by Yuksel et al. When a line segment ends, the first three control points are repeated, producing a closed loop.\n\nIf alpha is zero, produces a uniform spline, equivalent to `curveCardinal` with a tension of zero; if alpha is one,\nproduces a chordal spline; if alpha is 0.5, produces a [centripetal spline](https://en.wikipedia.org/wiki/Centripetal_Catmull–Rom_spline).\nCentripetal splines are recommended to avoid self-intersections and overshoot.\n\n
 \n\n",
"type": "Float -> Curve -> List PathSegment"
},
{
"name": "catmullRomCurveOpen",
"comment": " Produces a cubic Catmull–Rom spline using the specified control points and the parameter alpha (a good default is 0.5),\nas proposed by Yuksel et al. Unlike curveCatmullRom, one-sided differences are not used for the first and last piece, and thus the curve starts at the second point and ends at the penultimate point.\n\nIf alpha is zero, produces a uniform spline, equivalent to `curveCardinal` with a tension of zero; if alpha is one,\nproduces a chordal spline; if alpha is 0.5, produces a [centripetal spline](https://en.wikipedia.org/wiki/Centripetal_Catmull–Rom_spline).\nCentripetal splines are recommended to avoid self-intersections and overshoot.\n\n
 \n\n",
"type": "Float -> Curve -> List PathSegment"
},
{
"name": "centroid",
"comment": " Computes the midpoint (x, y) of the center line of the arc that would be\ngenerated by the given arguments. The midpoint is defined as\n(startAngle + endAngle) / 2 and (innerRadius + outerRadius) / 2. For example:\n\n[](http://code.gampleman.eu/elm-visualization/Centroid/)\n\nNote that this is not the geometric center of the arc, which may be outside the arc;\nthis function is merely a convenience for positioning labels.\n\n",
"type": "Arc -> Point"
},
{
"name": "defaultPieConfig",
"comment": " The default config for generating pies.\n\n import Visualization.Shape as Shape exposing (defaultPieConfig)\n\n pieData =\n Shape.pie { defaultPieConfig | outerRadius = 230 } model\n\nNote that if you change `valueFn`, you will likely also want to change `sortingFn`.\n\n",
"type": "PieConfig Float"
},
{
"name": "line",
"comment": " Generates a line for the given array of points which can be passed to the `d`\nattribute of the `path` SVG element. It needs to be suplied with a curve function.\nPoints accepted are `Maybe`s, Nothing represent gaps in the data and corresponding\ngaps will be rendered in the line.\n\n**Note:** A single point (surrounded by Nothing) may not be visible.\n\nUsually you will need to convert your data into a format supported by this function.\nFor example, if your data is a `List (Date, Float)`, you might use something like:\n\n lineGenerator : ( Date, Float ) -> Maybe ( Float, Float )\n lineGenerator ( x, y ) =\n Just ( Scale.convert xScale x, Scale.convert yScale y )\n\n linePath : List ( Date, Float ) -> String\n linePath data =\n List.map lineGenerator data\n |> Shape.line Shape.linearCurve\n\nwhere `xScale` and `yScale` would be appropriate `Scale`s.\n\n",
"type": "(Curve -> List PathSegment) -> List (Maybe Point) -> String"
},
{
"name": "lineRadial",
"comment": " This works exactly like `line`, except it interprets the points it recieves as `(angle, radius)`\npairs, where radius is in *radians*. Therefore it renders a radial layout with a center at `(0, 0)`.\n\nUse a transform to position the layout in final rendering.\n\n",
"type": "(Curve -> List PathSegment) -> List (Maybe Point) -> String"
},
{
"name": "linearCurve",
"comment": " Produces a polyline through the specified points.\n\n
 \n\n",
"type": "Curve -> List PathSegment"
},
{
"name": "monotoneInXCurve",
"comment": " Produces a cubic spline that [preserves monotonicity](http://adsabs.harvard.edu/full/1990A%26A...239..443S)\nin y, assuming monotonicity in x, as proposed by Steffen in\n[A simple method for monotonic interpolation in one dimension](http://adsabs.harvard.edu/full/1990A%26A...239..443S):\n“a smooth curve with continuous first-order derivatives that passes through any\ngiven set of data points without spurious oscillations. Local extrema can occur\nonly at grid points where they are given by the data, but not in between two adjacent grid points.”\n\n
 \n\n",
"type": "Curve -> List PathSegment"
},
{
"name": "monotoneInYCurve",
"comment": " Produces a cubic spline that [preserves monotonicity](http://adsabs.harvard.edu/full/1990A%26A...239..443S)\nin y, assuming monotonicity in y, as proposed by Steffen in\n[A simple method for monotonic interpolation in one dimension](http://adsabs.harvard.edu/full/1990A%26A...239..443S):\n“a smooth curve with continuous first-order derivatives that passes through any\ngiven set of data points without spurious oscillations. Local extrema can occur\nonly at grid points where they are given by the data, but not in between two adjacent grid points.”\n",
"type": "Curve -> List PathSegment"
},
{
"name": "naturalCurve",
"comment": " Produces a [natural](https://en.wikipedia.org/wiki/Spline_interpolation) [cubic spline](http://mathworld.wolfram.com/CubicSpline.html)\nwith the second derivative of the spline set to zero at the endpoints.\n\n
 \n\n",
"type": "Curve -> List PathSegment"
},
{
"name": "pie",
"comment": " The pie generator does not produce a shape directly, but instead computes\nthe necessary angles to represent a tabular dataset as a pie or donut chart;\nthese angles can then be passed to an `arc` generator.\n",
"type": "PieConfig a -> List a -> List Arc"
},
{
"name": "sortByInsideOut",
"comment": " Sort such that small values are at the outer edges, and large values in the middle.\n\nThis is the recommended order for stream graphs.\n\n",
"type": "(a -> Float) -> List a -> List a"
},
{
"name": "stack",
"comment": " Create a stack result\n",
"type": "StackConfig a -> StackResult a"
},
{
"name": "stackOffsetDiverging",
"comment": "
 \n\nPositive values are stacked above zero, negative values below zero.\n\n stackOffsetDiverging [ [ (0, 42) ], [ (0, -24) ] ]\n --> [ [ (0, 42) ], [ (-24, 0 ) ] ]\n\n stackOffsetDiverging [ [ (0, 42), (0, -20) ], [ (0, -24), (0, -24) ] ]\n --> [[(0,42),(-20,0)],[(-24,0),(-44,-20)]]\n\n",
"type": "List (List ( Float, Float )) -> List (List ( Float, Float ))"
},
{
"name": "stackOffsetExpand",
"comment": "
 \nApplies a zero baseline and normalizes the values for each point such that the topline is always one.\n\n stackOffsetExpand [ [ (0, 50) ], [ (50, 100) ] ]\n --> [[(0,0.5)],[(0.5,1)]]\n\n",
"type": "List (List ( Float, Float )) -> List (List ( Float, Float ))"
},
{
"name": "stackOffsetNone",
"comment": "
 \n\nStacks the values on top of each other, starting at 0.\n\n stackOffsetNone [ [ (0, 42) ], [ (0, 70) ] ]\n --> [ [ (0, 42) ], [ (42, 112 ) ] ]\n\n stackOffsetNone [ [ (0, 42) ], [ (20, 70) ] ]\n --> [ [ (0, 42) ], [ (42, 112 ) ] ]\n\n",
"type": "List (List ( Float, Float )) -> List (List ( Float, Float ))"
},
{
"name": "stackOffsetSilhouette",
"comment": "
 \nShifts the baseline down such that the center of the streamgraph is always at zero.\n\n stackOffsetSilhouette [ [ (0, 50) ], [ (50, 100) ] ]\n --> [[(-75,-25)],[(-25,75)]]\n\n",
"type": "List (List ( Float, Float )) -> List (List ( Float, Float ))"
},
{
"name": "stackOffsetWiggle",
"comment": "
 \nShifts the baseline so as to minimize the weighted wiggle of layers.\n\nVisually, high wiggle means peaks going in both directions very close to each other. The silhouette stack offset above often suffers\nfrom having high wiggle.\n\n stackOffsetWiggle [ [ (0, 50) ], [ (50, 100) ] ]\n --> [[(0,50)],[(50,150)]]\n\n",
"type": "List (List ( Float, Float )) -> List (List ( Float, Float ))"
},
{
"name": "stepCurve",
"comment": " Produces a piecewise constant function (a step function) consisting of alternating horizontal and vertical lines.\n\nThe factor parameter changes when the y-value changes between each pair of adjacent x-values.\n\n
 \n\n",
"type": "Float -> Curve -> List PathSegment"
}
],
"binops": []
},
{
"name": "Visualization.Histogram",
"comment": " A histogram is an accurate graphical representation of the distribution of\nnumerical data. It is an estimate of the probability distribution of a continuous\nvariable (quantitative variable)\n\n[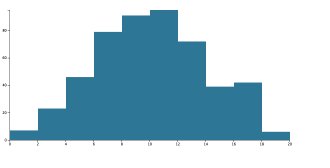](http://code.gampleman.eu/elm-visualization/Histogram/)\n\nTo compute a histogram, one first configures a Histogram Generator and then uses\nit to compute a histogram. Histograms can then be visualized in a variaty of ways,\nfor example using Svg rects and linear scales.\n\n\n### Configuring a Generator\n\n@docs HistogramGenerator, float, generator, custom, withDomain\n\n\n### Computing a Histogram\n\n@docs Bin, compute\n\n\n### Thresholds\n\n@docs Threshold, sturges, steps, binCount\n\n",
"unions": [
{
"name": "HistogramGenerator",
"comment": " Represents configuration to compute a histogram from a list of arbitrary data.\n\nHowever, to compute a histogram, the data must be made comparable, this is typically done\nthrough a conversion to a `Float`, however any `comparable` type will do.\n\n",
"args": [
"a",
"comparable"
],
"cases": []
}
],
"aliases": [
{
"name": "Bin",
"comment": " A bin holding data. All of the data falling into the bin is available in `values`. Each of the\n`values` (when transformed to a comparable) falls between `x0` and `x1`. The number of elements in the\nbin is available as `length`, which is equivalent to (but faster then) `List.length values`.\n",
"args": [
"a",
"comparable"
],
"type": "{ x0 : comparable, x1 : comparable, values : List a, length : Int }"
},
{
"name": "Threshold",
"comment": " A function that computes threshold values separating the individual bins. It is passed a function that\ncan convert values to comparables, the list of all valus and the extent (i.e. smallest and largest value).\nNote that the smallest and largest value may be the same, however the list of all values is guaranteed not to\nbe empty.\n\nIt must return a list of boundary values that separate the bins. If you wish to have `n` bins, this should\nreturn `n-1` thresholds.\n\n",
"args": [
"a",
"comparable"
],
"type": "(a -> comparable) -> List a -> ( a, a ) -> List comparable"
}
],
"values": [
{
"name": "binCount",
"comment": " Computes appropriate threshold values given an extent and the desired number of bins. Useful for implementing\nyour custom `Threshold` values when you have a way to compute the desired number of bins.\n",
"type": "( Float, Float ) -> Int -> List Float"
},
{
"name": "compute",
"comment": " Given some data and a configured HistogramGenerator, computes the binning of the data.\n\nIf the data is empty, returns an empty list.\n\n",
"type": "List a -> HistogramGenerator a comparable -> List (Bin a comparable)"
},
{
"name": "custom",
"comment": " Create a custom generator by supplying your own threshold function and a mapping function.\n",
"type": "Threshold a comparable -> (a -> comparable) -> HistogramGenerator a comparable"
},
{
"name": "float",
"comment": " Create a histogram generator that takes float data and uses Sturges' formula for thresholding.\n",
"type": "HistogramGenerator Float Float"
},
{
"name": "generator",
"comment": " Make histograms with arbitrary data passing in a function that converts the data to a Float.\n\nThis is pretty similar to using `Histogram.float` and `List.map`ing your data in advance, however\nhere you will have access to the original data in the bins if needed for further analysis.\n\n",
"type": "(a -> Float) -> HistogramGenerator a Float"
},
{
"name": "steps",
"comment": " For creating an appropriate Threshold value if you already have appropriate\nThreshold values (i.e. from `Scale.ticks`).\n",
"type": "List a -> Threshold a comparable"
},
{
"name": "sturges",
"comment": " Returns the threshold values according to [Sturges’ formula](https://en.wikipedia.org/wiki/Histogram#Mathematical_definition).\nThis is a decent default value, however it implicitly assumes an approximately normal distribution and may perform poorly\nif you have less than 30 data points.\n",
"type": "Threshold a Float"
},
{
"name": "withDomain",
"comment": " Set the domain for the HistogramGenerator. All values falling outside the domain will be ignored.\n",
"type": "( a, a ) -> HistogramGenerator a comparable -> HistogramGenerator a comparable"
}
],
"binops": []
},
{
"name": "Visualization.Path",
"comment": " This module provides an abstraction over drawing complex paths. Currently it\ncontains a function to convert this representation into a string suitable for the\n`d` attribute of the `path` SVG element. However, the ADT that powers this is\npublicly exposed and alternative renderers can be built in e.g. Canvas or WebGL.\n\nThe functions here are modeled after the [Canvas API](https://developer.mozilla.org/en-US/docs/Web/API/CanvasRenderingContext2D#Paths).\n\n*Deprecated:* In a future major release this module will be removed in favor of [folkertdev/one-true-path-experiment][otp] or\nit's successors, as they provide a safe, high quality wrapper over path based drawing that should be interoperable with\nother packages. To make migration easier, the `toOneTruePath` function is provided, so that downstream code can\nstart working with [folkertdev/one-true-path-experiment][otp],\nrather than the datatypes provided in this module, yet still inter-operate.\n\n\n# Datatype\n\n@docs PathSegment, Path\n\n\n# Converting\n\n@docs toAttrString, toOneTruePath\n\n\n# DSL\n\nThe DSL can be used interchangebly with directly writing the datatype above.\n\n begin\n |> moveTo 30 50\n |> lineTo 20 70\n |> lineTo 40 23\n |> close\n\nIs equivalent to:\n\n --> [Move (30, 50), Line (20, 70), Line (40, 23), Close]\n\n@docs begin, moveTo, lineTo, close, quadraticCurveTo, bezierCurveTo, arcTo, arc, rect\n\n",
"unions": [
{
"name": "PathSegment",
"comment": " A list of `PathSegment`s represents a path. These are essentially drawing\ncommands that are based on the Canvas API. For more information, see the DSL\nsection in this module.\n",
"args": [],
"cases": [
[
"Move",
[
"Point"
]
],
[
"Close",
[]
],
[
"Line",
[
"Point"
]
],
[
"QuadraticCurve",
[
"Point",
"Point"
]
],
[
"BezierCurve",
[
"Point",
"Point",
"Point"
]
],
[
"Arc",
[
"Point",
"Point",
"Float"
]
],
[
"ArcCustom",
[
"Point",
"Float",
"Float",
"Float",
"Bool"
]
],
[
"Rect",
[
"Point",
"( Float, Float )"
]
]
]
}
],
"aliases": [
{
"name": "Path",
"comment": " ",
"args": [],
"type": "List PathSegment"
}
],
"values": [
{
"name": "arc",
"comment": " Draws a circular arc segment with the specified center ⟨x, y⟩, radius,\nstartAngle and endAngle. If anticlockwise is true, the arc is drawn in the\nanticlockwise direction; otherwise, it is drawn in the clockwise direction.\nIf the current point is not equal to the starting point of the arc, a straight\nline is drawn from the current point to the start of the arc.\n\n arc x y radius startAngle endAngle anticlockwise\n\n",
"type": "Float -> Float -> Float -> Float -> Float -> Bool -> Path -> Path"
},
{
"name": "arcTo",
"comment": " Draws a circular arc segment with the specified radius that starts tangent\nto the line between the current point and the specified point ⟨x1, y1⟩ and ends\ntangent to the line between the specified points ⟨x1, y1⟩ and ⟨x2, y2⟩. If the\nfirst tangent point is not equal to the current point, a straight line is drawn\nbetween the current point and the first tangent point.\n\n arcTo x1 y1 x2 y2 radius\n\n",
"type": "Float -> Float -> Float -> Float -> Float -> Path -> Path"
},
{
"name": "begin",
"comment": " Start a new path. Equivalent to `[]`.\n",
"type": "Path"
},
{
"name": "bezierCurveTo",
"comment": " Draws a cubic Bézier segment from the current point to the specified\npoint ⟨x, y⟩, with the specified control points ⟨cpx1, cpy1⟩ and ⟨cpx2, cpy2⟩.\n\n bezierCurveTo cpx1 cpy1 cpx2 cpy2 x y\n\n",
"type": "Float -> Float -> Float -> Float -> Float -> Float -> Path -> Path"
},
{
"name": "close",
"comment": " Ends the current subpath and causes an automatic straight line to be drawn\nfrom the current point to the initial point of the current subpath.\n",
"type": "Path -> Path"
},
{
"name": "lineTo",
"comment": " Draws a straight line from the current point to the specified point ⟨x, y⟩.\n",
"type": "Float -> Float -> Path -> Path"
},
{
"name": "moveTo",
"comment": " Move to the specified point ⟨x, y⟩ and start a new subpath.\n\n**Note:** In SVG having multiple `moveTo` commands following each other draws\nan implicit path between them. Do not rely on this behavior, in the future this\nmay be removed.\n\n",
"type": "Float -> Float -> Path -> Path"
},
{
"name": "quadraticCurveTo",
"comment": " Draws a quadratic Bézier segment from the current point to the specified\npoint ⟨x, y⟩, with the specified control point ⟨cpx, cpy⟩.\n\n quadraticCurveTo cpx cpy x y\n\n",
"type": "Float -> Float -> Float -> Float -> Path -> Path"
},
{
"name": "rect",
"comment": " Creates a new subpath containing just the four points ⟨x, y⟩, ⟨x + w, y⟩,\n⟨x + w, y + h⟩, ⟨x, y + h⟩, with those four points connected by straight lines,\nand then marks the subpath as closed.\n\n rect x y w h\n\n",
"type": "Float -> Float -> Float -> Float -> Path -> Path"
},
{
"name": "toAttrString",
"comment": " Transforms a path to a string that can be passed into the `d` attribute of the\n`path` SVG element.\n\n begin\n |> moveTo 100 100\n |> arcTo 200 100 200 200 50\n |> arc 150 150 50 0 pi False\n |> toAttrString\n --> \"M100,100 L150,100 A50,50 0 0 1 200,150 A50,50 0 1 1 100,150\"\n\n",
"type": "Path -> String"
},
{
"name": "toOneTruePath",
"comment": " Transforms the path to a path from the [folkertdev/one-true-path-experiment][otp]\nlibrary. This allows you to do fancy math on the path data - with the hope that this will enable animation library authors\nto build general purpose transitions between these.\n\n[otp]: https://github.com/folkertdev/one-true-path-experiment\n\n",
"type": "Path -> Path"
}
],
"binops": []
},
{
"name": "Visualization.List",
"comment": " This module exposes functions on list which are useful for the domain of data\nvisualization. Most of these work with Lists of numbers.\n\n\n# Statistics\n\n@docs extent, extentWith\n\n\n# Transformations\n\nMethods for transforming list and for generating new lists.\n\n@docs ticks, tickStep, range\n\n",
"unions": [],
"aliases": [],
"values": [
{
"name": "extent",
"comment": " Returns the minimum and maximum value in the list.\n",
"type": "List comparable -> Maybe ( comparable, comparable )"
},
{
"name": "extentWith",
"comment": " Returns the minimum and maximum value in the given array using comparisons\nfrom values passed by the accessor function.\n\n data : List { name : String, age : Int}\n data =\n [ {name = \"John Smith\", age = 32 }\n , {name = \"Mark Luther\", age = 45 }\n , {name = \"Cory Jones\", age = 26 }\n ]\n\n extentWith .age data\n --> Just ({name = \"Cory Jones\", age = 26 }\n --> , {name = \"Mark Luther\", age = 45 })\n\n",
"type": "(a -> comparable) -> List a -> Maybe ( a, a )"
},
{
"name": "range",
"comment": " Returns a List containing an arithmetic progression, similar to the Python\nbuilt-in range. This method is often used to iterate over a sequence of\nuniformly-spaced numeric values, such as the indexes of an array or the ticks of\na linear scale. (See also [ticks](#ticks) for nicely-rounded values.)\n\nTakes a `start`, `stop` and `step` argument. The stop value is exclusive; it is not\nincluded in the result. If `step` is positive, the last element is the largest\n`start + i * step` less than `stop`; if `step` is negative, the last element is\nthe smallest `start + i * step` greater than `stop`. If the returned list would\ncontain an infinite number of values, an empty range is returned.\n\nThe arguments are not required to be whole numbers; however, the results are more\npredictable if they are.\n\nDifferences from [List.range from the standard library](http://package.elm-lang.org/packages/elm-lang/core/5.1.1/List#range):\n\n - `List.range` is inclusive, meaning that the stop value will be included in the result\n - `List.range` only supports `Int`, whereas this supports any number types\n - `List.range` supports only increasing intervals (i.e. `List.range 3 1 == []` vs. `range 3 1 -1 == [3, 2]`).\n - `List.range` doesn't allow for specifying the step value\n - `List.range` is most likely faster\n\n",
"type": "number -> number -> number -> List number"
},
{
"name": "tickStep",
"comment": " Returns the difference between adjacent tick values if the same arguments\nwere passed to `ticks`: a nicely-rounded value that is a power of ten multiplied\nby 1, 2 or 5. Note that due to the limited precision of IEEE 754 floating point,\nthe returned value may not be exact decimals.\n\n tickStep 1.9 6.4 10 --> 0.5\n\n tickStep 1.9 6 5 --> 1\n\n",
"type": "Float -> Float -> Int -> Float"
},
{
"name": "ticks",
"comment": " Returns a list of approximately n + 1 uniformly-spaced, nicely-rounded\nvalues between a start and stop value (inclusive). Each value is a power of ten\nmultiplied by 1, 2 or 5. Note that due to the limited precision of IEEE 754\nfloating point, the returned values may not be exact decimals.\n\nTicks are inclusive in the sense that they may include the specified start and\nstop values if (and only if) they are exact, nicely-rounded values consistent\nwith the inferred step. More formally, each returned tick t satisfies\nstart ≤ t and t ≤ stop.\n\n ticks 1.9 6.4 10 --> [2, 2.5, 3, 3.5, 4, 4.5, 5, 5.5, 6]\n\n ticks 1.9 6 5 --> [2, 3, 4, 5, 6]\n\n",
"type": "Float -> Float -> Int -> List Float"
}
],
"binops": []
},
{
"name": "Visualization.Force",
"comment": " This module implements a velocity Verlet numerical integrator for simulating physical forces on particles.\nThe simulation is simplified: it assumes a constant unit time step *Δt = 1* for each step, and a constant unit\nmass *m = 1* for all particles. As a result, a force *F* acting on a particle is equivalent to a constant\nacceleration *a* over the time interval *Δt*, and can be simulated simply by adding to the particle’s velocity,\nwhich is then added to the particle’s position.\n\n
 \n\nIn the domain of information visualization, physical simulations are useful for studying networks and hierarchies!\n\n\n## Simulation\n\n@docs Entity, entity, simulation, State, isCompleted, reheat, iterations, computeSimulation, tick\n\n\n## Forces\n\n@docs Force, center, links, customLinks, manyBody, manyBodyStrength\n\n",
"unions": [
{
"name": "Force",
"comment": " A force modifies nodes’ positions or velocities; in this context, a force can apply a classical physical force such\nas electrical charge or gravity, or it can resolve a geometric constraint, such as keeping nodes within a bounding box\nor keeping linked nodes a fixed distance apart.\n",
"args": [
"comparable"
],
"cases": []
},
{
"name": "State",
"comment": " This holds internal state of the simulation.\n",
"args": [
"comparable"
],
"cases": []
}
],
"aliases": [
{
"name": "Entity",
"comment": " Visualization.Force needs to compute and update positions and velocities on any objects that it is simulating.\nHowever, you can use your own data structure to manage these, as long as the individual objects expose the necessary\nproperties. Therefore this type alias is an extensible record allowing you to avoid excessive nesting.\n\nThe `id` property must be unique among objects, otherwise some of the colliding objects will be ignored by the simulation.\n\nAlso take care when initializing the positions so that the points don't overlap.\n\n",
"args": [
"comparable",
"a"
],
"type": "{ a | x : Float, y : Float, vx : Float, vy : Float, id : comparable }"
}
],
"values": [
{
"name": "center",
"comment": " The centering force translates nodes uniformly so that the mean position of all nodes (the center of mass) is at\nthe given position ⟨x,y⟩. This force modifies the positions of nodes on each application; it does not modify velocities,\nas doing so would typically cause the nodes to overshoot and oscillate around the desired center. This force helps keep\nnodes in the center of the viewport, and it does not distort their relative positions.\n",
"type": "Float -> Float -> Force comparable"
},
{
"name": "computeSimulation",
"comment": " This will run the entire simulation until it is completed and then returns the entities. Essentially keeps calling\n`tick` until the simulation is done.\n\nNote that computing these is fairly computationally expensive and may freeze the UI for a while if the dataset is large.\n\n",
"type": "State comparable -> List (Entity comparable a) -> List (Entity comparable a)"
},
{
"name": "customLinks",
"comment": " Allows you to specify the link distance and optionally the strength. You must also specify the iterations count,\nhowever this parameter is currently ignored (so set it to 1). This will change in a future release.\n",
"type": "Int -> List { source : comparable, target : comparable, distance : Float, strength : Maybe Float } -> Force comparable"
},
{
"name": "entity",
"comment": " This is a conveninence function for wrapping data up as Entities. The initial position of entities is arranged\nin a [phylotaxic pattern](http://code.gampleman.eu/elm-visualization/Petals/).\n",
"type": "Int -> a -> Entity Int { value : a }"
},
{
"name": "isCompleted",
"comment": " Has the simulation stopped?\n",
"type": "State comparable -> Bool"
},
{
"name": "iterations",
"comment": " You can set this to control how quickly the simulation should converge. The default value is 300 iterations.\n\nLower number of iterations will produce a layout quicker, but risk getting stuck in a local minimum. Higher values take\nlonger, but typically produce better results.\n\n",
"type": "Int -> State comparable -> State comparable"
},
{
"name": "links",
"comment": " The link force pushes linked nodes together or apart according to the desired link distance. The strength of the\nforce is proportional to the difference between the linked nodes’ distance and the target distance, similar to a spring\nforce.\n\nThe link distance here is 30, the strength of the force is proportional to the number of links on each side of the\npresent link, according to the formule: `1 / min (count souce) (count target)` where `count` if a function that counts\nlinks connected to those nodes.\n\n",
"type": "List ( comparable, comparable ) -> Force comparable"
},
{
"name": "manyBody",
"comment": " The many-body (or n-body) force applies mutually amongst all nodes. It can be used to simulate gravity (attraction)\nif the strength is positive, or electrostatic charge (repulsion) if the strength is negative.\n\nUnlike links, which only affect two linked nodes, the charge force is global: it affects all nodes whose ids are passed\nto it.\n\nThe default strength is -30 simulating a repulsing charge.\n\n",
"type": "List comparable -> Force comparable"
},
{
"name": "manyBodyStrength",
"comment": " This allows you to specify the strength of the many-body force.\n",
"type": "Float -> List comparable -> Force comparable"
},
{
"name": "reheat",
"comment": " Resets the computation. This is useful if you need to change the parameters at runtime, such as the position or\nvelocity of nodes during a drag operation.\n",
"type": "State comparable -> State comparable"
},
{
"name": "simulation",
"comment": " Create a new simulation by passing a list of forces.\n",
"type": "List (Force comparable) -> State comparable"
},
{
"name": "tick",
"comment": " Advances the simulation a single tick, returning both updated entities and a new State of the simulation.\n",
"type": "State comparable -> List (Entity comparable a) -> ( State comparable, List (Entity comparable a) )"
}
],
"binops": []
}
]