Vectual
A simple to use charting library written in Elm. It visualizes data and helps you to understand it. Display beautiful charts and customize them in various ways.
Attention:
This software is still a alpha version.
It might not work as expected and the API may change at any time.
For a live example page, check out vectual.org.
Currently it supports line charts, pie charts, bar charts, and stacked bar charts.
Visualizations
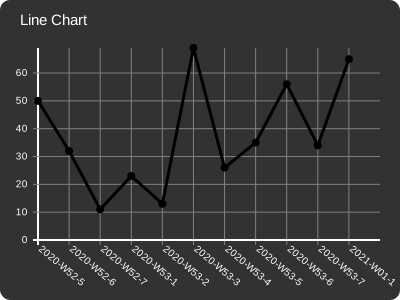 | 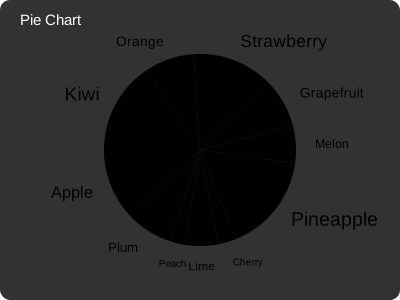 |
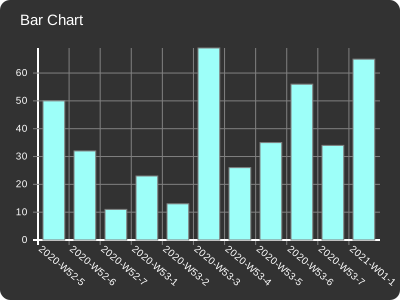 | 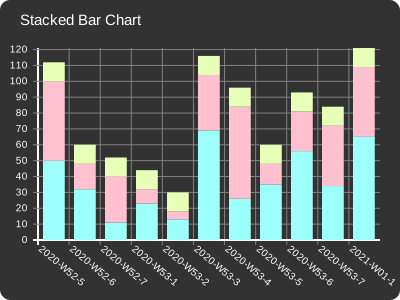 |
Coming Soon
Tag Cloud
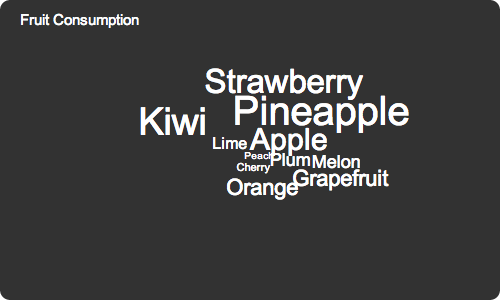
Need a short overview on whats hot or not? Then you might like the awesome tag cloud feature.
Map
Is my video more popular in Asia or in Europe? It's never been easier to display the answer.
Table
There is nothing more convenient than a simple table to display exact values. Customize it to show just the relevant information.
Export
You want to integrate the pretty charts in your e-mails, presentations or e-books? No problem! Export them as SVG images!
Related
- Elm Visualization - A data visualization library for Elm.
Modules
- Stylus.Parser
- TimeUtils.Compare
- TimeUtils.Config
- TimeUtils.Config.Configs
- TimeUtils.Core
- TimeUtils.Create
- TimeUtils.Duration
- TimeUtils.Field
- TimeUtils.Format
- TimeUtils.Period
- TimeUtils.Time
- TimeUtils.TimeUnit
- TimeUtils.TwelveHourClock
- TimeUtils.TypeAlias
- TimeUtils.Utils
- Vectual
- Vectual.BarChart
- Vectual.BarChartStacked
- Vectual.CoordinateSystem
- Vectual.Helpers
- Vectual.PieChart
- Vectual.Types