elm-array-view
Visualization of an array using pure Elm. This package utilizes the elm-dagre package to generate the rendered output.
It uses the ArrayView module to display the required output, in accordance with the attribute values set by the user.
There are two attribute modules with which the user can configure the rendered output :
- Layout - Attributes which make an impact on the layout of the rendered array.
- Render - Attributes which affect the configuration of the array containers, it doesn't change the layout in any way.
Example code utilizing this package can be viewed in the \examples folder.
Objectives
- To design and implement a custom drawer function in pure Elm which takes in a user defined array as a parameter and outputs a clean representation of it in an SVG container.
- To make the visualizing of an array seamless and minimalistic, without testing the users proficiency in graph-related attributes with the help of abstraction.
- To allow the user to add their own custom attributes to modify the rendered output, without any inconvenience.
Rundown
import Array
import ArrayView as AV
import Html exposing (Html)
import Render.Attributes as A exposing (elemDrawer, svgDrawNode)

main : Html  msg
main =
	AV.draw
		[]
		[ elemDrawer
			(svgDrawNode
				[ A.label (\n -> String.fromInt n.label)
				, A.xLabel (\n -> String.fromInt n.id)
				, A.xLabelPos (\_  _  _ -> ( 0, 65 ))
				]
			)
		]
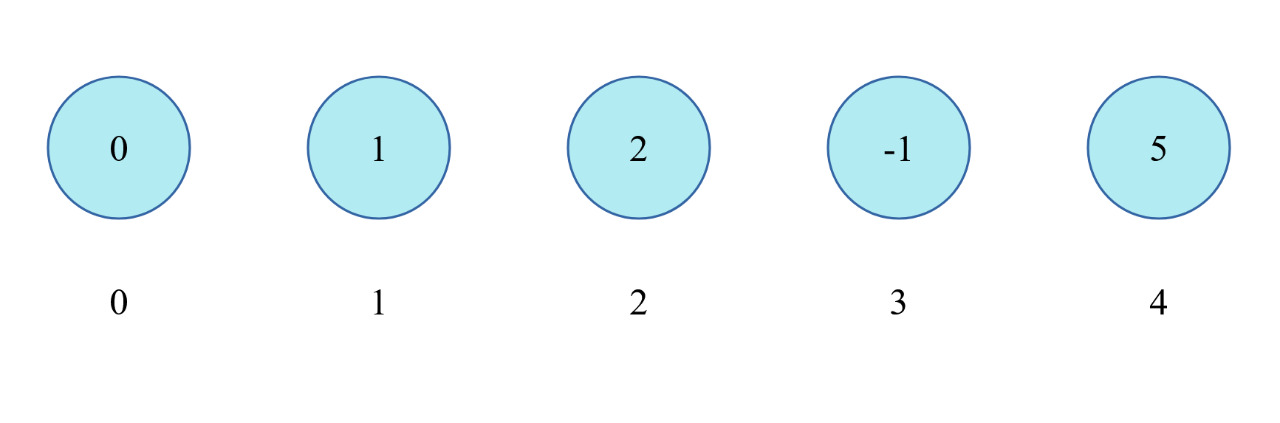
		(Array.fromList [ 0, 1, 2, -1, 5 ])
Output
Future Work
Add visualizations for more datastructures like
- Stacks
- Queues
- Lists
Add an attribute which allows the user to add multiple indices, for now the
xlabelattribute is utilized to do the same, which only adds one label to the visualization.
Attribution
This package is essentially an extension of elm-dagre. Many thanks to the contributors of the package.