elm-chart-builder
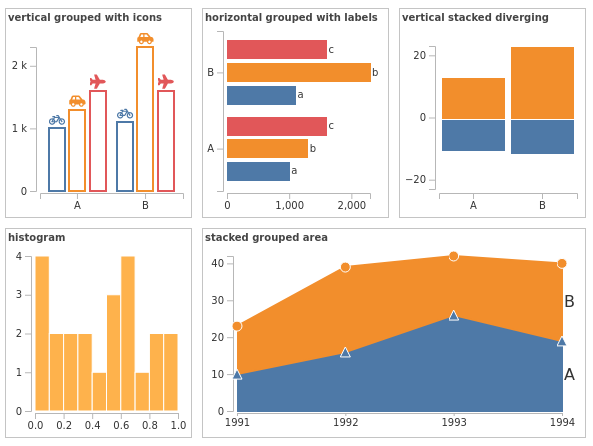
An opinionated and accessible charting library for elm based on gampleman/elm-visualization and elm-community/typed-svg.
The aim of this package is to expose an easy and intuitive api for building a variety of accessible chart types.
It is an opinionated library, because every charting module represents a very specific charting choice. If your aim is to build some personalized charts not covered here, then you should probably try a more low level library such as gampleman/elm-visualization.
All chart modules are being developed with full accessibility in mind (work in progress).
Core concepts
To build a chart you need:
- Your data
- An accessor function that tells elm-chart-builder how to get x and y values from the data, and how to group them.
- A configuration (data structure) that tells elm-chart-builder how the chart should look
Build your configuration in a pipeline:
- Start with 'init', which takes all the mandatory parameters,
- pipe through functions that set options,
- and end with 'render' which takes your data and accessor and returns your chart as
Html msg.
Bar.init
    { margin =
        { top = 10
        , right = 10
        , bottom = 30
        , left = 30
        }
    , width = 500
    , height = 200
    }
    |> Bar.withStackedLayout Bar.noDirection
    |> Bar.render
        ( [ ("a", 10 ), ("b", 20 )]
        , Bar.Accessor (always Nothing)
            Tuple.first
            Tuple.second
        )
Documentation
Find the documentation on Elm's package website.
Examples
It expects elm to already be installed and accessible.
$ cd examples
$ elm reactor
and open examples.
Online Examples
Tests:
It expects elm-test to already be installed and accessible.
$ elm-testelm-anlyse:
It expects elm-analyse to already be installed and accessible.
$ elm-analyse > elm-analyse.logscreenshot tests:
It expects the elm reactor server to be already running on port 8000.
$ cd screenshot-tests
$ npm install

# Check if a page in the examples folder has changed unexpectedly after a code change:
$ node tests.js

# If the change was intentional, reset the images:
$ node tests.js --reset