Visualization.Shape
Visualizations typically consist of discrete graphical marks, such as symbols, arcs, lines and areas. While the rectangles of a bar chart may be easy enough to generate directly using SVG or Canvas, other shapes are complex, such as rounded annular sectors and centripetal Catmull–Rom splines. This module provides a variety of shape generators for your convenience.
Note: Currently only rudimentary forms are implemented.
Arcs

Used to configure an arc. These can be generated by a pie, but you can
easily modify these later.
innerRadius : Float
Usefull for creating a donut chart. A negative value is treated as zero. If larger
than outerRadius they are swapped.
outerRadius : Float
The radius of the arc. A negative value is treated as zero. If smaller
than innerRadius they are swapped.
cornerRadius : Float
If the corner radius is greater than zero, the corners of the arc are rounded using circles of the given radius. For a circular sector, the two outer corners are rounded; for an annular sector, all four corners are rounded. The corner circles are shown in this diagram:

The corner radius may not be larger than (outerRadius - innerRadius) / 2.
In addition, for arcs whose angular span is less than π, the corner radius may
be reduced as two adjacent rounded corners intersect. This is occurs more often
with the inner corners.
startAngle : Float
The angle is specified in radians, with 0 at -y (12 o’clock) and positive angles proceeding clockwise. If |endAngle - startAngle| ≥ τ, a complete circle or annulus is generated rather than a sector.
endAngle : Float
The angle is specified in radians, with 0 at -y (12 o’clock) and positive angles proceeding clockwise. If |endAngle - startAngle| ≥ τ, a complete circle or annulus is generated rather than a sector.
padAngle : Float
The pad angle is converted to a fixed linear distance separating adjacent arcs, defined as padRadius * padAngle. This distance is subtracted equally from the start and end of the arc. If the arc forms a complete circle or annulus, as when |endAngle - startAngle| ≥ τ, the pad angle is ignored.
If the inner radius or angular span is small relative to the pad angle, it may not be possible to maintain parallel edges between adjacent arcs. In this case, the inner edge of the arc may collapse to a point, similar to a circular sector. For this reason, padding is typically only applied to annular sectors (i.e., when innerRadius is positive), as shown in this diagram:

The recommended minimum inner radius when using padding is outerRadius * padAngle / sin(θ), where θ is the angular span of the smallest arc before padding. For example, if the outer radius is 200 pixels and the pad angle is 0.02 radians, a reasonable θ is 0.04 radians, and a reasonable inner radius is 100 pixels.
Often, the pad angle is not set directly on the arc generator, but is instead computed by the pie generator so as to ensure that the area of padded arcs is proportional to their value. If you apply a constant pad angle to the arc generator directly, it tends to subtract disproportionately from smaller arcs, introducing distortion.
padRadius : Float
The pad radius determines the fixed linear distance separating adjacent arcs, defined as padRadius * padAngle.
Computes the midpoint (x, y) of the center line of the arc that would be generated by the given arguments. The midpoint is defined as (startAngle + endAngle) / 2 and (innerRadius + outerRadius) / 2. For example:

Note that this is not the geometric center of the arc, which may be outside the arc; this function is merely a convenience for positioning labels.
Pies
Used to configure a pie generator function.
innerRadius, outerRadius, cornerRadius and padRadius are simply forwarded
to the Arc result. They are provided here simply for convenience.
valueFn : a -> Float
This is used to compute the actual numerical value used for computing the angles.
You may use a List.map to preprocess data into numbers instead, but this is
useful if trying to use sortingFn.
sortingFn : a -> a -> Order
Sorts the data. Sorting does not affect the order of the generated arc list, which is always in the same order as the input data list; it merely affects the computed angles of each arc. The first arc starts at the start angle and the last arc ends at the end angle.
startAngle : Float
The start angle here means the overall start angle of the pie, i.e., the start angle of the first arc. The units of angle are arbitrary, but if you plan to use the pie generator in conjunction with an arc generator, you should specify an angle in radians, with 0 at -y (12 o’clock) and positive angles proceeding clockwise.
endAngle : Float
The end angle here means the overall end angle of the pie, i.e., the end angle of the last arc. The units of angle are arbitrary, but if you plan to use the pie generator in conjunction with an arc generator, you should specify an angle in radians, with 0 at -y (12 o’clock) and positive angles proceeding clockwise.
The value of the end angle is constrained to startAngle ± τ, such that |endAngle - startAngle| ≤ τ.
padAngle : Float
The pad angle here means the angular separation between each adjacent arc. The total amount of padding reserved is the specified angle times the number of elements in the input data list, and at most |endAngle - startAngle|; the remaining space is then divided proportionally by value such that the relative area of each arc is preserved.
The pie generator does not produce a shape directly, but instead computes
the necessary angles to represent a tabular dataset as a pie or donut chart;
these angles can then be passed to an arc generator.
The default config for generating pies.
import Visualization.Shape as Shape exposing (defaultPieConfig)


pieData = Shape.pie {defaultPieConfig | outerRadius = 230 } model
Note that if you change valueFn, you will likely also want to change sortingFn.
Lines

Generates a line for the given array of points which can be passed to the d
attribute of the path SVG element. It needs to be suplied with a curve function.
Points accepted are Maybes, Nothing represent gaps in the data and corresponding
gaps will be rendered in the line.
Note: A single point (surrounded by Nothing) may not be visible.
Usually you will need to convert your data into a format supported by this function.
For example, if your data is a List (Date, Float), you might use something like:
lineGenerator : ( Date, Float ) -> Maybe ( Float, Float )
lineGenerator ( x, y ) =
    Just ( Scale.convert xScale x, Scale.convert yScale y )


linePath : List (Date, Float) -> String
linePath data =
    List.map lineGenerator data
        |> Shape.line Shape.linearCurve
where xScale and yScale would be appropriate Scales.
The area generator produces an area, as in an area chart. An area is defined
by two bounding lines, either splines or polylines. Typically, the two lines
share the same x-values (x0 = x1), differing only in y-value (y0 and y1);
most commonly, y0 is defined as a constant representing zero. The first line
(the topline) is defined by x1 and y1 and is rendered first; the second line
(the baseline) is defined by x0 and y0 and is rendered second, with the points
in reverse order. With a linearCurve curve, this produces a clockwise polygon.
The data attribute you pass in should be a [Just ((x0, y0), (x1, y1))]. Passing
in Nothing represents gaps in the data and corresponding gaps in the area will
be rendered.
Usually you will need to convert your data into a format supported by this function.
For example, if your data is a List (Date, Float), you might use something like:
areaGenerator : ( Date, Float ) -> Maybe ( ( Float, Float ), ( Float, Float ) )
areaGenerator ( x, y ) =
    Just ( ( Scale.convert xScale x, Tuple.first (Scale.rangeExtent yScale) ),
           ( Scale.convert xScale x, Scale.convert yScale y ) )


areaPath : List (Date, Float) -> String
areaPath data =
    List.map areaGenerator data
        |> Shape.area Shape.linearCurve
where xScale and yScale would be appropriate Scales.
Curves
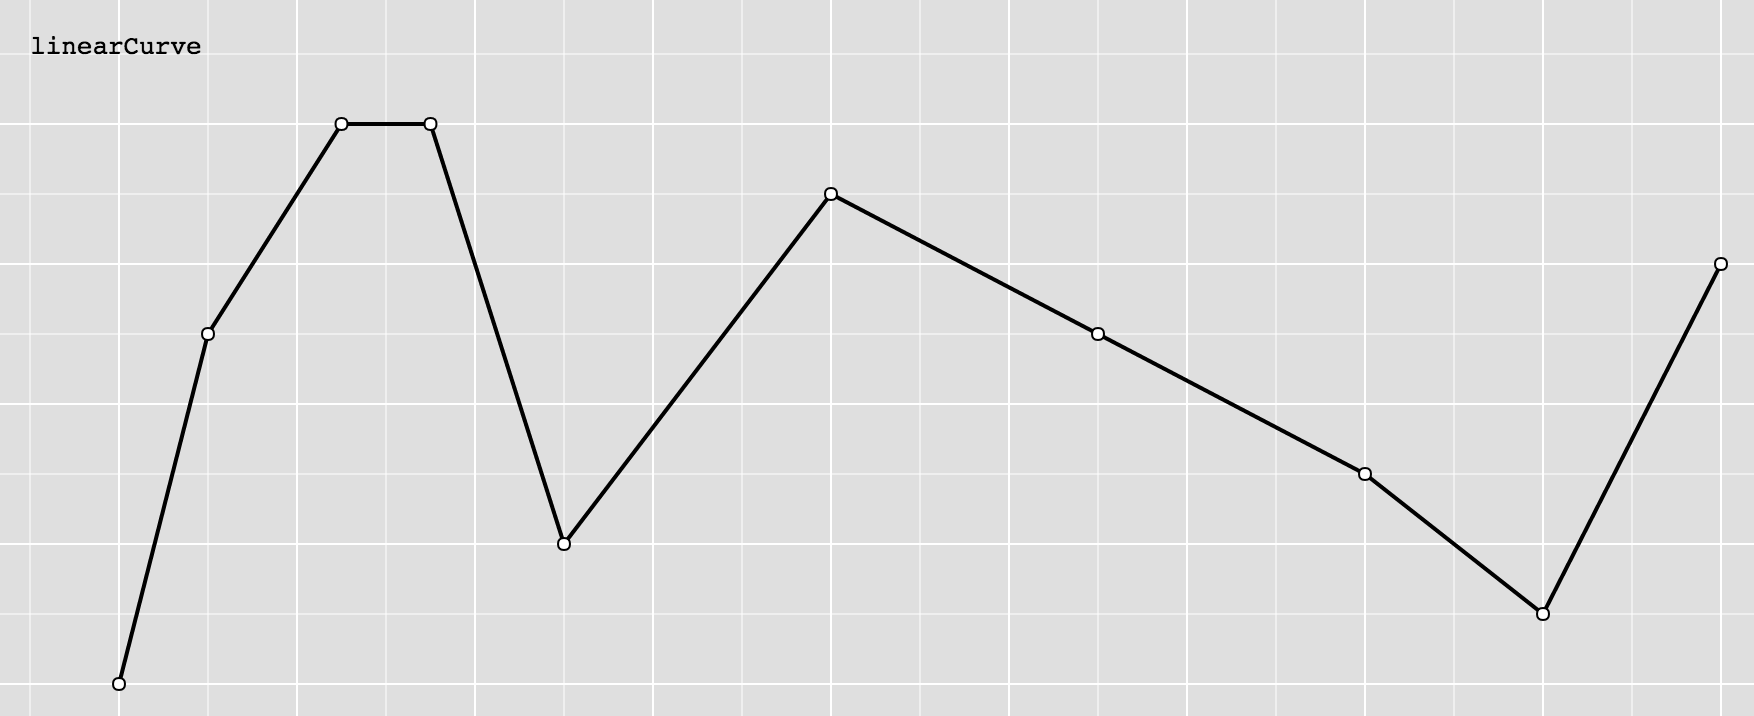
Produces a polyline through the specified points.
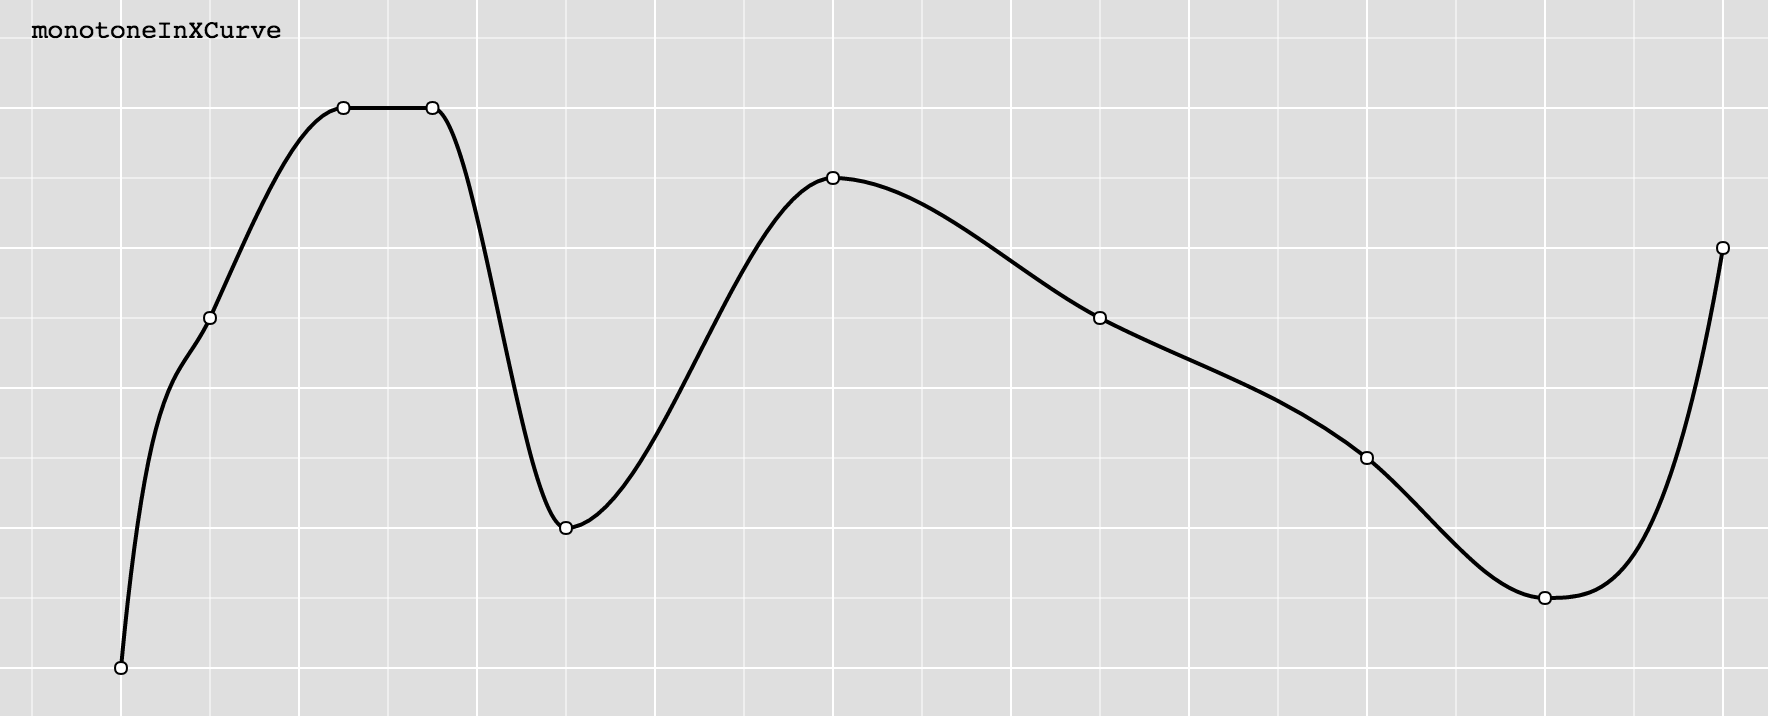
Produces a cubic spline that preserves monotonicity in y, assuming monotonicity in x, as proposed by Steffen in A simple method for monotonic interpolation in one dimension: “a smooth curve with continuous first-order derivatives that passes through any given set of data points without spurious oscillations. Local extrema can occur only at grid points where they are given by the data, but not in between two adjacent grid points.”
A curve is represented as a list of points, which a curve function can turn into drawing commands.
Note: The intention is to eventually open this type so that custom curves may be implemented, but I will first implement a number of curves to make sure the type makes sense.
The arc generator produces a circular or annular sector, as in a pie or donut chart. If the difference between the start and end angles (the angular span) is greater than τ, the arc generator will produce a complete circle or annulus. If it is less than τ, arcs may have rounded corners and angular padding. Arcs are always centered at ⟨0,0⟩; use a transform to move the arc to a different position.
See also the pie generator, which computes the necessary angles to represent an array of data as a pie or donut chart; these angles can then be passed to an arc generator.
This will produce a string suitable to being passed into the
dattribute of an SVGpathelement.