CellGrid
The CellGrid package provides a type for representing and rendering a rectangular grid of cells. The grid can respond to mouse clicks, and there are three rendering options: HTML, SVG, and WebGL. Here is what a cellGrid structure looks like:
type CellGrid a
    = CellGrid ( Int, Int ) (Array a)
There are two on-line demo applications: Conway's game of life, and a simulation
of heat conduction. See the examples folder on GitHub
for the code. In the first example, we use the type
CellGrid State, where
type State = Occupied | UnoccupiedIn the second, we use CellGrid Float. The idea is the
cell contents (the floating point number) represents
the temperature of the cell.
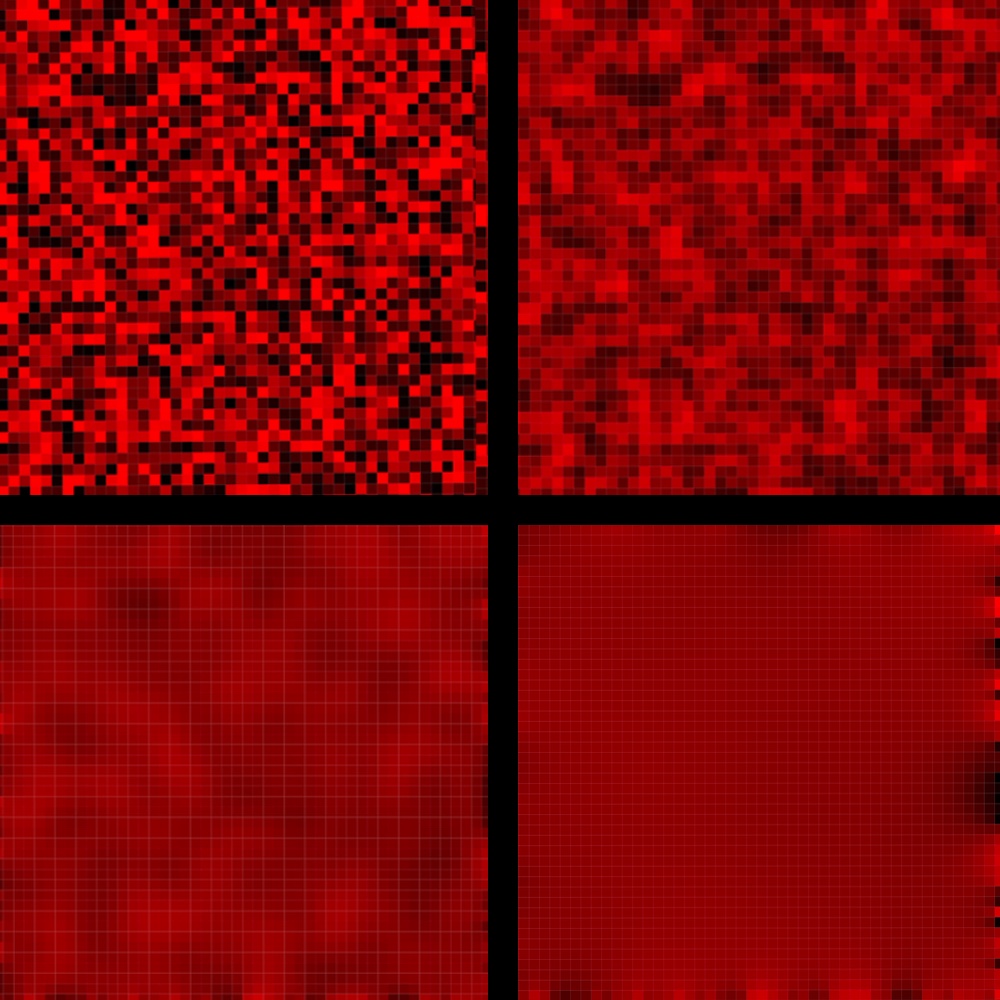
One can create a CellGrid, transform it, and render it both SVG and HTML, as in the figure below (taken from the simulation in examples/HeatEquation)
Note the type
type Msg = MouseClick (Int, Int) (Float, Float)It is referenced by the function which renders a cell
so that when the user clicks on a cell, a message
is sent containing the matrix index (i,j) of the cell
in question as well as its local floating
point coordinates (x,y). In ./examples/GameOfLife.elm,
see the files Main.elm to see how this message is used.
Creating a CellGrid
In the example below, we create a 2x2 CellGrid Float.
> import CellGrid exposing(..)
> import Array exposing(Array)
```

```
> cells = Array.fromList [1.0,2.0,3.0,4.0]
Array.fromList [1,2,3,4]
    : Array Float
```

```
> cg = CellGrid (2,2) cells
CellGrid (2,2) (Array.fromList [1,2,3,4])
    : CellGrid Float
```

Elements of a `CellGrid` can be accessed as one expects
in a 2D array:

```
> cellAtMatrixIndex (1,1) cg
Just 4 : Maybe Float
```

## Rendering a CellGrid (Html and SVG)

Render a `CellGrid` using the function

```
renderAsHtml : Int -> Int ->  CellRenderer a
               -> CellGrid a -> Html msg
```

where the first two parameters are the width and
height of the rendered Cellgrid in pixels,
and where the third defines how a cell is rndered:

```
type alias CellRenderer a = {
       cellSize : Float
     , gridLineWidth : Float
     , cellColorizer : a -> Color
     , defaultColor : Color
     , gridLineColor: Color

  }
```

A `ColorValue` is a type alias for `String`.  Here is a typical
`CellRenderer`:

```
type alias CellRenderer a = {
       cellSize : Float
     , gridLineWidth : Float
     , cellColorizer : a -> Color
     , defaultColor : Color
     , gridLineColor: Color
  }
```

For a `CellGrid Float`, the contents of a cell is real number.
The above `cellColorizer` function converts cell contents to a
string that SVG understands as representing an RGB color, in this
case, a shade of red.  See `examples/HeatEquation/Main.elm` for
an illustration of how this is used.

By using cellColorizers, one can render any kind of CellGrid.
For example, in Conway's Game of Life,  one  uses the function


```
cellrenderer : CellRenderer Float
cellrenderer =
    {
         cellSize = 10
       , cellColorizer = \z -> Color.rgb z 0 0
       , defaultColor = Color.rgb 0 0 0
       , gridLineColor = Color.rgb 180 0 0
       , gridLineWidth = 0.5
    }
```

## Rendering a CellGrid (WebGL)

Please consult `./examples/HeatMap2.elm`.
One uses

```
CellGrid.WebGL.cellGridToHtml 700 700
   (testGrid ( 200, 200 )) colorMap
```

to render the 200x200 CellGrid `testGrid ( 200, 200 )`.
The `colorMap` function transforms scalars (Float),
to color vectors (Vec3).  Here is a simple example:

```
colorMap : Float -> Vec3
colorMap t =
    vec3 t 0 0
```

It is also possible to render a mesh, as in  `./examples/HeatMap.elm`:

```
CellGrid.WebGL.meshToHtml 700 700 (testMesh 200 0.04)
```

The value `testMesh 200 0.04` is a mesh.