CellGrid
The CellGrid package provides a type for representing and rendering a rectangular grid of cells. The grid can be rendered as HTML, SVG, or WebGL. In the HTML and SVG versions, the grid responds to mouse clicks. Here is the type definition:
type CellGrid a
    = CellGrid ( Int, Int ) (Array a)
Thus
cg = CellGrid (2,3) (Array Int)sets up a CellGrid with two rows and three columns, with each cell carrying an integer payload.
There are two on-line demo applications: Conway's game of life, and a simulation
of heat conduction. See the examples folder on GitHub
for the code. In the first example, we use the type
CellGrid State,where
type State = Occupied | UnoccupiedIn the second, we use
CellGrid FloatIn this case, the contents of a cell represents its temperature. One can create a CellGrid, transform it, and render as SVG HTML, or WebGL. Note the type
type Msg = MouseClick (Int, Int) (Float, Float)It is referenced by the function which renders a cell
so that when the user clicks on a cell, a message
is sent containing the matrix index (i,j) of the cell
in question as well as its local floating
point coordinates (x,y). Consult ./examples/GameOfLife.elm,
to see how this message is used to respond to user clicks.
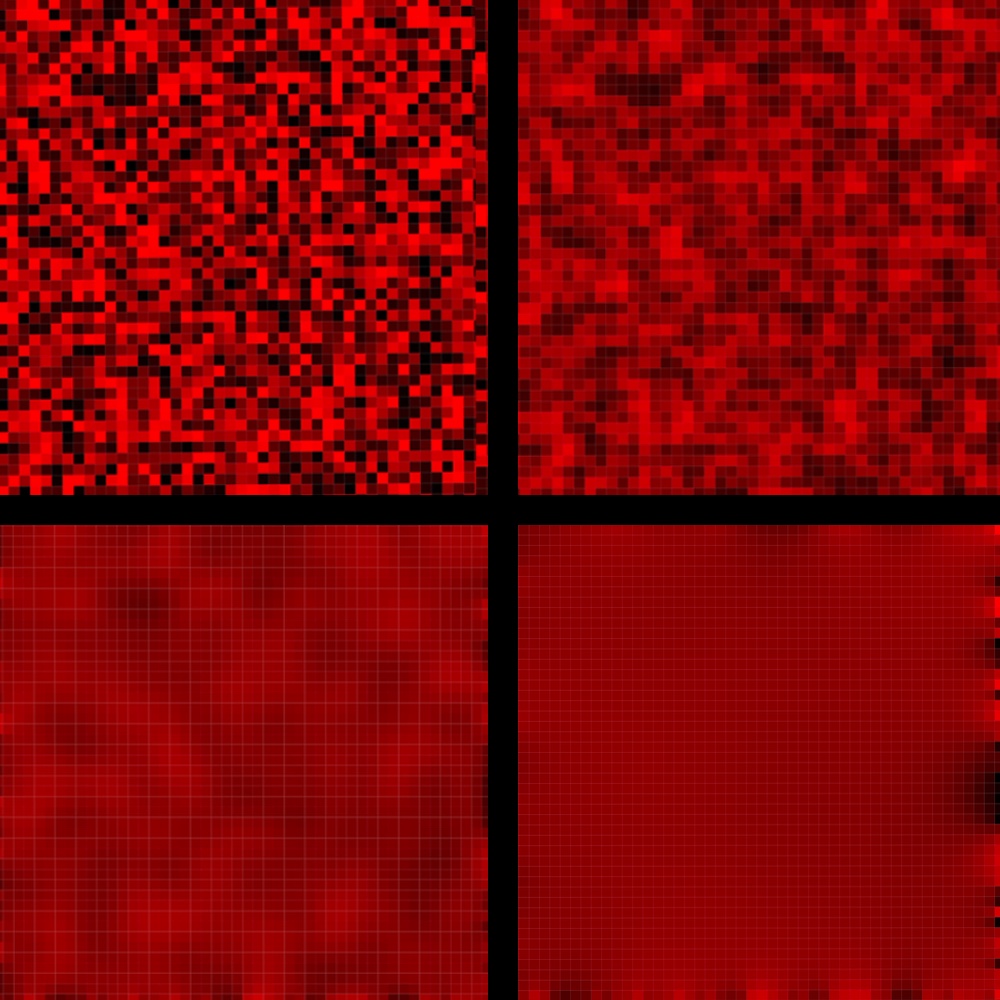
Creating a CellGrid
In the example below, we create a 2x2 CellGrid Float.
> import CellGrid exposing(..)
> import Array exposing(Array)
```

```
> cells = Array.fromList [1.0,2.0,3.0,4.0]
Array.fromList [1,2,3,4]
    : Array Float
```

```
> cg = CellGrid (2,2) cells
CellGrid (2,2) (Array.fromList [1,2,3,4])
    : CellGrid Float
```

Elements of a `CellGrid` can be accessed as one expects
in a 2D array:

```
> cellAtMatrixIndex (1,1) cg
Just 4 : Maybe Float
```

## Rendering a CellGrid (Html and SVG)

Render a `CellGrid` using the function

```
asHtml : Int -> Int ->  CellRenderer a
               -> CellGrid a -> Html msg
```

where the first two parameters are the width and
height of the rendered Cellgrid in pixels,
and where the third defines how a cell is rndered:

```
type alias CellRenderer a = {
       cellSize : Float
     , gridLineWidth : Float
     , cellColorizer : a -> Color
     , defaultColor : Color
     , gridLineColor: Color

  }
```

A `ColorValue` is a type alias for `String`.  Here is a typical
`CellRenderer`:

```
type alias CellRenderer a = {
       cellSize : Float
     , gridLineWidth : Float
     , cellColorizer : a -> Color
     , defaultColor : Color
     , gridLineColor: Color
  }
```

For a `CellGrid Float`, the contents of a cell is real number.
The above `cellColorizer` function converts cell contents to a
string that SVG understands as representing an RGB color, in this
case, a shade of red.  See `examples/HeatEquation/Main.elm` for
an illustration of how this is used.

By using cellColorizers, one can render any kind of CellGrid.
For example, in Conway's Game of Life,  one  uses the function


```
cellrenderer : CellRenderer Float
cellrenderer =
    {
         cellSize = 10
       , cellColorizer = \z -> Color.rgb z 0 0
       , defaultColor = Color.rgb 0 0 0
       , gridLineColor = Color.rgb 180 0 0
       , gridLineWidth = 0.5
    }
```

## Rendering a CellGrid (WebGL)

Please consult `./examples/HeatMap2.elm`.
One uses

```
CellGrid.WebGL.asHtml 700 700
   (testGrid ( 200, 200 )) colorMap
```

to render the 200x200 CellGrid `testGrid ( 200, 200 )`.
The `colorMap` function transforms scalars (Float),
to color vectors (Vec3).  Here is a simple example:

```
colorMap : Float -> Vec3
colorMap t =
    vec3 t 0 0
```

It is also possible to render a mesh, as in  `./examples/HeatMap.elm`:

```
CellGrid.WebGL.meshToHtml 700 700 (testMesh 200 0.04)
```

The value `testMesh 200 0.04` is a mesh.