Graph
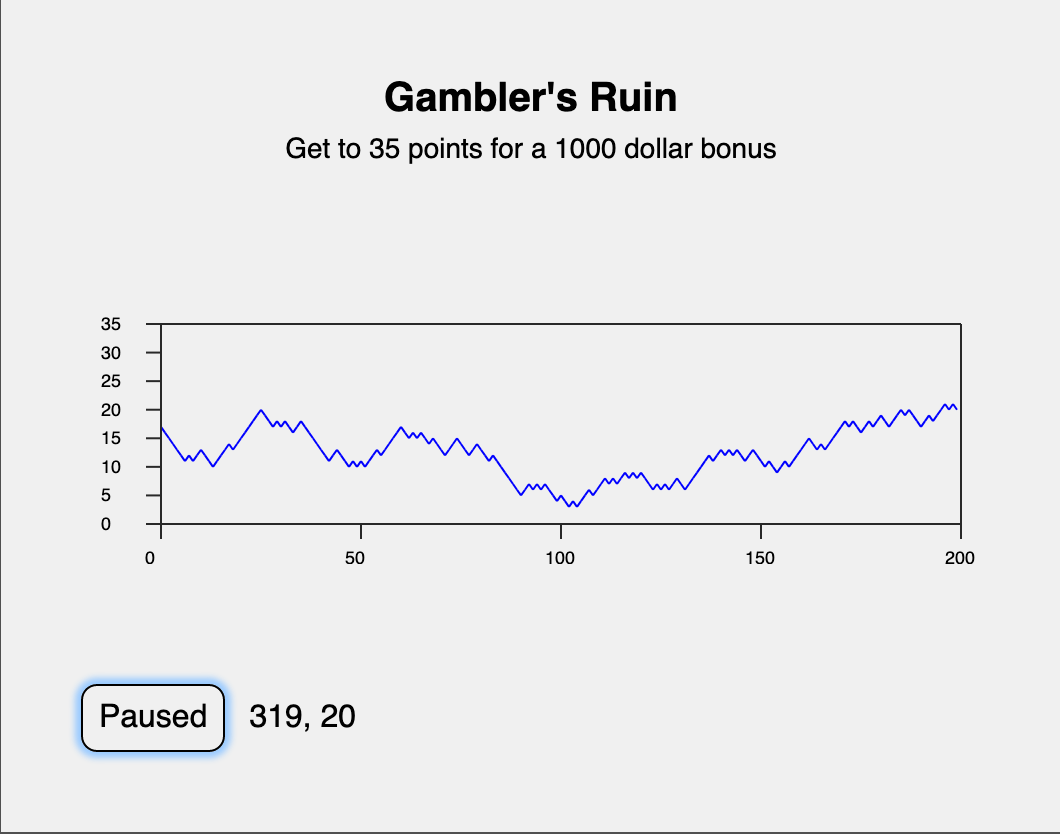
Graph is a bare-bones package for rendering data as line and bar charts. For a demo, see https://jxxcarlson.github.io/app/gamblers_ruin.html
Line charts
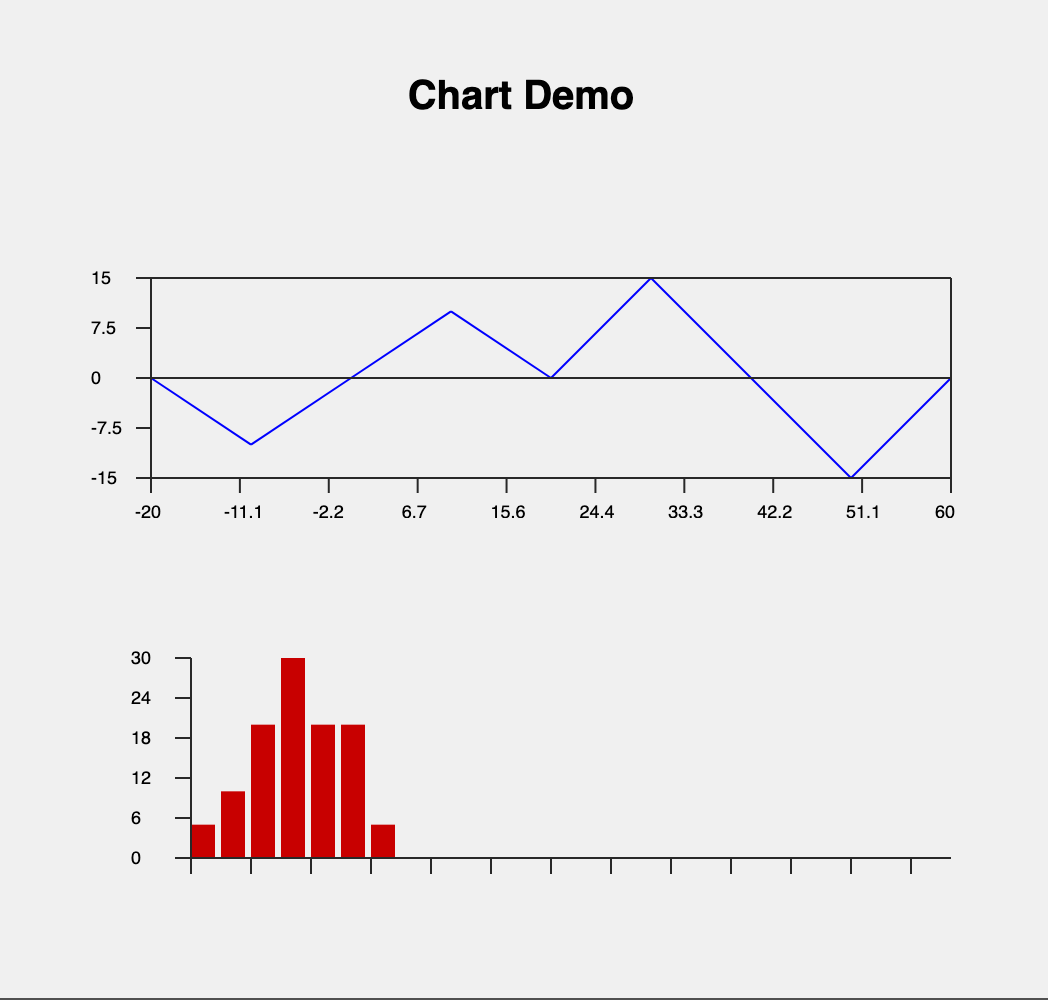
lineData  : List (Float, Float)
lineData =
    [(-20, 0), (-10,-10), (0,0), (10, 10), (20,0), (30,15), (40,0), (50,-15), (60, 0)]


lineGraphAttributes =
    {   graphHeight = 100
      , graphWidth = 400
      , options = [ Color "blue", XTickmarks 10, YTickmarks 5]
    }


 lineChart lineGraphAttributes lineData
Bar charts
barData : List Float
barData = [5, 10, 20, 30, 20, 20, 5]


barGraphAttributes =
   {   graphHeight = 100
     , graphWidth = 400
     , options = [Color "rgb(200,0,0)", DeltaX 15, YTickmarks 6, XTickmarks 2]
   }


barChart barGraphAttributes data2
Demos
For a demo of the package, do
$ git clone https://github.com/jxxcarlson/simplechart.git
$ cd simplechart/examples/
$ elm make Main.elm
Then open the resulting index.html file. You might also
look at the gamblers's ruin demo, which uses a manually configured
data window:
$ elm make GamblersRuin.elm