Elm-stat
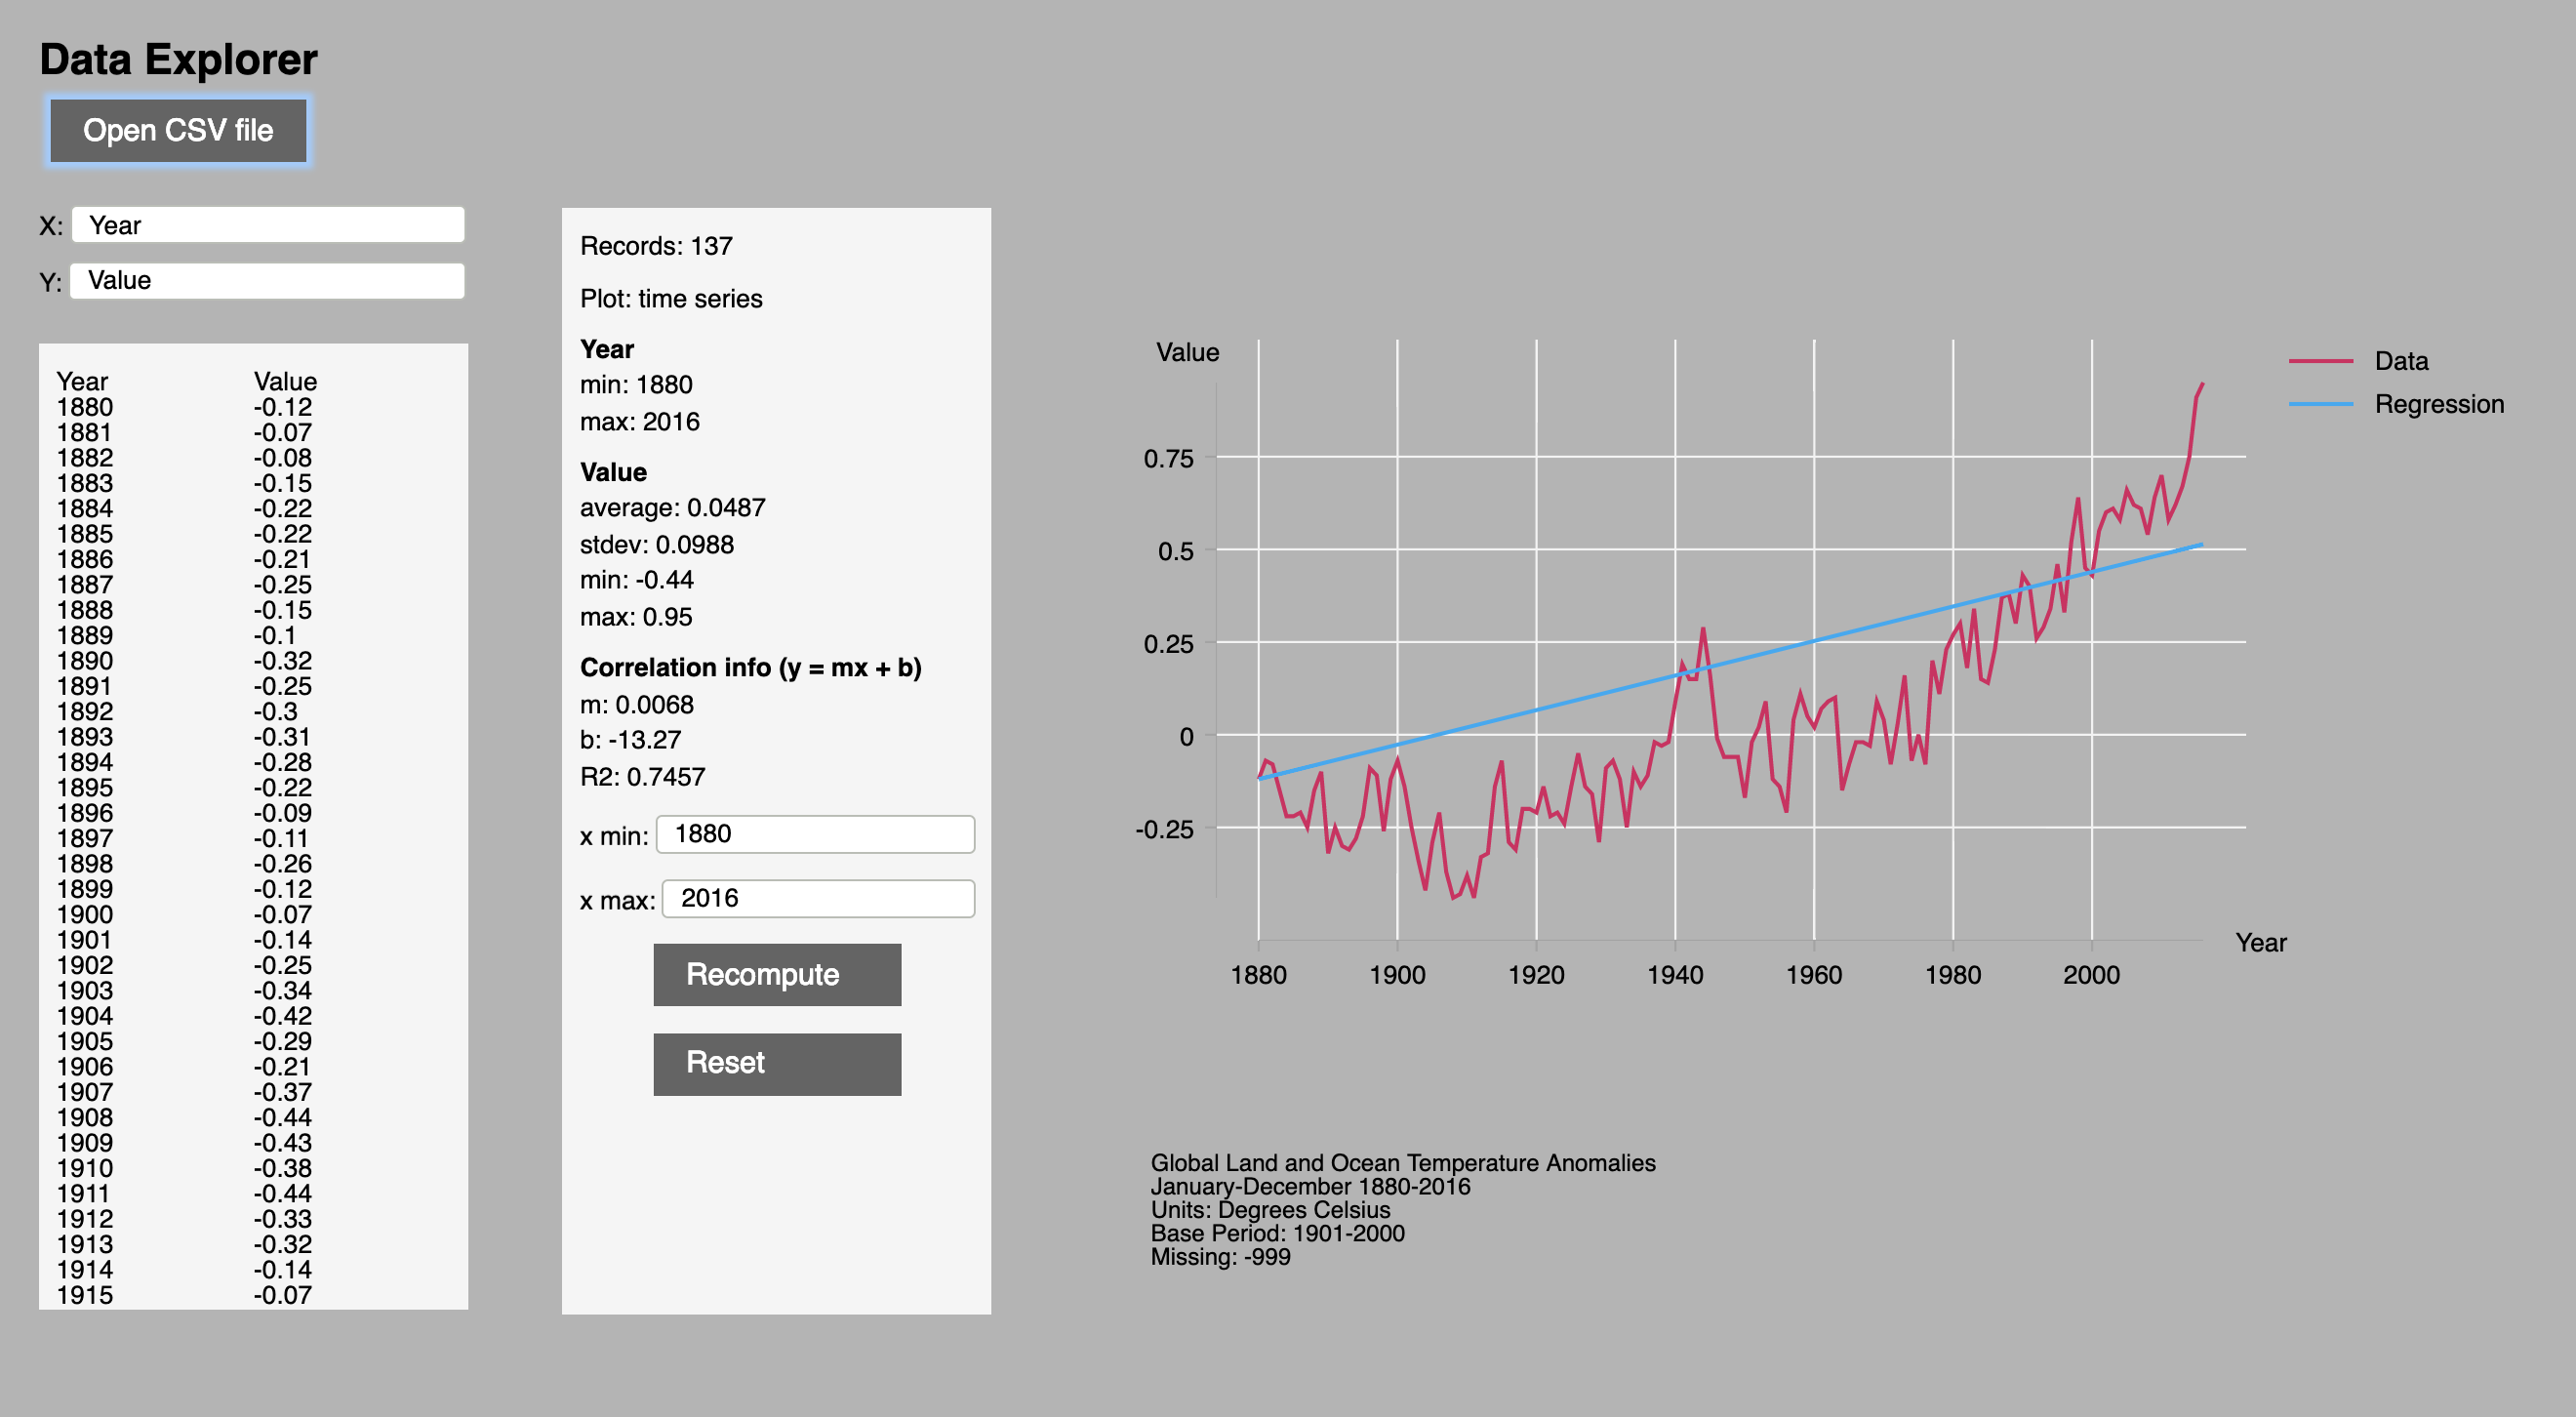
This package is for doing statistics and graphs for 2-column csv files.
The image above displays an analysis of time series data.
It is computed by the app in the examples folder using this elm-stat library. See
the Demo App to try the app out on line.
The API
There are two modules, Stat, for computing statistics of 2-D data, and CsvData, for extracting Csv data from a text string and for extracting 2-D data from Csv.
The Stat module has functions for computing statistical measures such as the mean and standard deviation of the x or y values, coefficients for the linear regression line, etc.
The Example
The data used in the example in the file temperature-anomalies.csv in this repo. It is a list of global temperature anomalies for the period 1880-2017 from www.climate.gov. The annual temperature anomaly is the difference between the global mean temperature and the long-term mean global temperature. For this data set, the long-term mean is computed for the period 1901-2000. Here is what the data looks like:
Global Land and Ocean Temperature Anomalies, January-December
Units: Degrees Celsius
Base Period: 1901-2000
Year,Value
1880,-0.12
1881,-0.07
...
2015,0.91
2016,0.95