Histogram
A histogram is an accurate graphical representation of the distribution of numerical data. It is an estimate of the probability distribution of a continuous variable (quantitative variable)
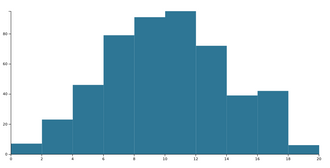
To compute a histogram, one first configures a Histogram Generator and then uses it to compute a histogram. Histograms can then be visualized in a variety of ways, for example using Svg rects and linear scales.
Configuring a Generator
Create a histogram generator that takes float data and uses Sturges' formula for thresholding.
Make histograms with arbitrary data passing in a function that converts the data to a Float.
This is pretty similar to using Histogram.float and List.maping your data in advance, however
here you will have access to the original data in the bins if needed for further analysis.
Create a custom generator by supplying your own threshold function and a mapping function.
Set the domain for the HistogramGenerator. All values falling outside the domain will be ignored.
Computing a Histogram
A bin holding data. All of the data falling into the bin is available in values. Each of the
values (when transformed to a comparable) falls between x0 and x1. The number of elements in the
bin is available as length, which is equivalent to (but faster then) List.length values.
Given some data and a configured HistogramGenerator, computes the binning of the data.
If the data is empty, returns an empty list.
Thresholds
A function that computes threshold values separating the individual bins. It is passed a function that can convert values to comparables, the list of all valus and the extent (i.e. smallest and largest value). Note that the smallest and largest value may be the same, however the list of all values is guaranteed not to be empty.
It must return a list of boundary values that separate the bins. If you wish to have n bins, this should
return n-1 thresholds.
Returns the threshold values according to Sturges’ formula. This is a decent default value, however it implicitly assumes an approximately normal distribution and may perform poorly if you have less than 30 data points.
For creating an appropriate Threshold value if you already have appropriate
Threshold values (i.e. from Scale.ticks).
Computes appropriate threshold values given an extent and the desired number of bins. Useful for implementing
your custom Threshold values when you have a way to compute the desired number of bins.
Represents configuration to compute a histogram from a list of arbitrary data.
However, to compute a histogram, the data must be made comparable, this is typically done through a conversion to a
Float, however anycomparabletype will do.