Evg.Path
Draw arbitrary shapes out of straight lines and curves.
A path is a shape drawn by moving an imaginary pen: you place it somewhere, then draw straight lines and curves from point to point. Most shapes that aren't simple rectangles or circles (icons, chart lines, arrows, country outlines) end up being paths.
Every point is a pair of ( x, y ) numbers measured from the top-left
corner of the drawing: x grows to the right, y grows downward.
This module offers two ways of describing the same shape:
Pathlists the pen movements one after another, much like you would describe the shape out loud ("start here, line to there, curve over to there"). Use it to construct paths.Segmentdescribes the shape as a list of independent pieces, each knowing its own start and end points. Use it for computations like measuring a path or finding points along it.
You can convert freely between them with toSegments and fromSegments.
Path Commands
Paths are built from a starting point and a sequence of drawing commands.
Uppercase constructors (M, L, C, and so on) use absolute coordinates:
"draw a line to the point (90, 90)". Lowercase functions (m, l, c,
and so on) use coordinates relative to wherever the pen currently is:
"draw a line 80 units to the right".
import Evg.Path exposing (Path(..), PathSegment(..))


-- Absolute: a triangle with its tip at the top
triangle =
    M ( 50, 10 ) [ L ( 90, 90 ), L ( 10, 90 ), Z ]


-- Relative: a square starting at (10, 10),
-- each side 80 units
square =
    M ( 10, 10 )
        [ l ( 80, 0 )
        , l ( 0, 80 )
        , l ( -80, 0 )
        , Z
]The individual pen movements, each using absolute coordinates. For every
one of these there is also a lowercase function (l, h, c, and so on)
that does the same thing with coordinates relative to the current pen position.
L pointdraws a straight line to the pointH xdraws a horizontal line to the given x coordinateV ydraws a vertical line to the given y coordinateC cp1 cp2 enddraws a cubic curve; the two control points each pull their end of the line toward themselves, so the curve can bend one way and then the other, like an SS cp2 endcontinues a previous curve smoothly, so you only supply the second control pointQ cp enddraws a quadratic curve, a simple bow bent toward one control pointT endcontinues a previous quadratic curve smoothly, needing no control point at allA rx ry rotation largeArc sweep enddraws an arc, a slice of an ellipse outline, good for pie charts and rounded cornersZcloses the shape with a straight line back to where the stroke began
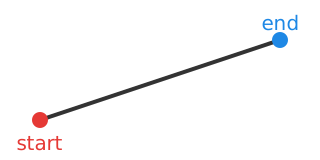
The straight line commands look like this: L heads directly from the
current position to the point you give it.
For details and pictures of each curve type, see the matching lowercase functions below.
Relative Commands
These produce path segments with coordinates relative to the current point.
Lift the pen and put it down again at an offset from where the previous stroke ended, starting a new stroke there. Nothing is drawn by the move itself.
m ( 10, 20 ) [ l ( 50, 0 ), l ( 0, 50 ), Z ]This starts a new triangle 10 units right and 20 units down from wherever the previous stroke finished.
Draw a straight line from the current pen position, offset by the given amount. The first number moves right (negative moves left), the second moves down (negative moves up).
l ( 80, 0 ) -- 80 right


l ( 0, -40 ) -- 40 upDraw a horizontal line from the current pen position. Positive amounts
go right, negative ones go left. It is a convenient shorthand for l when
you know the line should be perfectly level.
The picture shows a horizontal line followed by a vertical one:
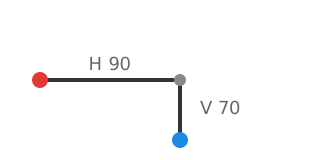
h 100 -- 100 units right


h -50 -- 50 units leftDraw a vertical line from the current pen position. Positive amounts go
down, negative ones go up. Like h, this is a shorthand for l when the
line should be perfectly upright.
v 80 -- 80 units down


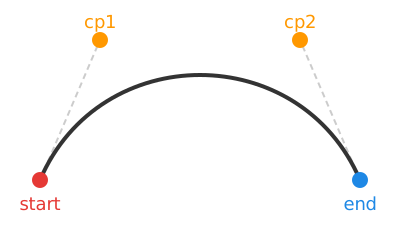
v -30 -- 30 units upDraw a cubic curve, shaped by two invisible control points. The first control point pulls the start of the line toward itself, the second pulls the end. Because each end can be pulled in a different direction, a cubic curve can bend one way and then the other, giving it an S capability that the simpler quadratic curve lacks. This is the workhorse curve: reach for it when you need precise control over how a curve leaves one point and arrives at another.
In the picture, the dashed lines connect each end of the curve to the control point pulling on it:
All three points are offsets from the current pen position:
c ( 0, -50 ) ( 80, -50 ) ( 80, 0 )This draws an arch that rises 50 units and lands 80 units to the right.
Continue a cubic curve smoothly. You give only the second control point and the end point; the first control point is computed automatically by mirroring the previous curve's last control point, which guarantees there is no visible kink where the two curves meet. Use it when chaining several cubic curves into one flowing line, such as a wave.
In the picture, a regular cubic curve (dark) is continued by a smooth one (blue); the mirrored control point is shown as a dashed circle:
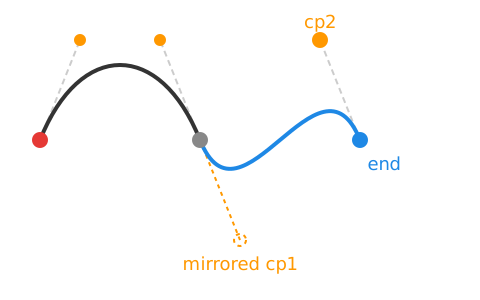
Both points are offsets from the current pen position:
s ( 40, -30 ) ( 80, 0 )Draw a quadratic curve, shaped by a single invisible control point. The line bows toward the control point without ever touching it, like a rope being tugged from one side. It always bends in just one direction, so it is the simplest way to soften a line when you don't need the S shapes a cubic curve can make.
In the picture, the dashed lines connect the ends of the curve to the control point pulling on it:
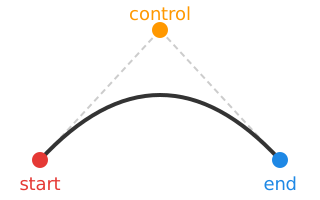
Both points are offsets from the current pen position:
q ( 40, -60 ) ( 80, 0 )This draws a bow that arcs upward and lands 80 units to the right.
Continue a quadratic curve smoothly. You give only the end point; the
control point is computed automatically by mirroring the previous curve's
control point, so the joined curves flow into each other without a kink.
Chaining t after a q is an easy way to draw a wavy line.
In the picture, a quadratic curve (dark) is continued by a smooth one (blue); the mirrored control point is shown as a dashed circle:
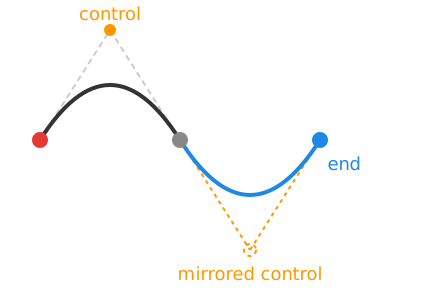
The end point is an offset from the current pen position:
t ( 40, 0 )Draw an arc, a slice of an ellipse outline, from the current pen position to an end point. Arcs are what you reach for when drawing pie chart slices, rounded corners, or anything else that should look like part of a circle.
You describe the ellipse the arc is cut from (rx and ry are its
horizontal and vertical radii; make them equal for a circular arc, and
rotation tilts the whole ellipse by that many degrees). Between any two
points there are four possible arcs of that ellipse: a long way round and a
short way round, on either side of the line between the points. Two flags
pick which one you get. largeArc = True chooses the longer route, and
sweep = True makes the pen curve clockwise rather than counterclockwise.
Every panel in the picture uses the same start point, end point, and radii. Only the two flags differ, and each combination picks out a different one of the four arcs. The blue arc is the one selected; the pale arcs are the other three possibilities:
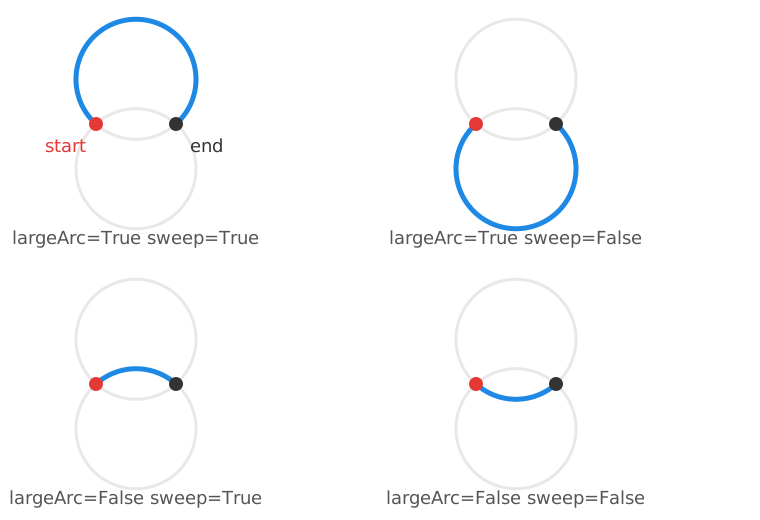
The end point is an offset from the current pen position:
a 50 50 0 False True ( 100, 0 )This draws the short clockwise half of a circle, bulging upward, ending 100 units to the right.
Utilities
Close every stroke in the path by drawing a straight line from wherever it ends back to where it began, turning open lines into sealed outlines.
The point where the pen finishes after drawing the whole path, in other words the end of the final stroke. Handy when you want to continue drawing from where a path left off or attach something to its tip.
The point where the pen is first put down, in other words the start of
the first stroke. A path whose first stroke uses the relative m
starts relative to the origin, so its offset is its starting point.
Geometric Segments
A Segment represents a single piece of a path with explicit start and end
points. This is more convenient for computations (measuring length, sampling
points, transforming) since you don't need to track the "current point" state.
A single piece of a path with explicit start and end points. This representation is more convenient for geometric computation, since you always know where each piece starts and ends without tracking any pen state. It also has only 4 constructors, which makes comprehensive case statements much easier to write.
Lineis a straight line between two pointsQuadraticis a curve pulled toward one control pointCubicis a curve pulled by two control points, one for each endArcis a slice of an ellipse outline
Convert paths into a list of geometric segments, resolving all the relative movements so that each segment knows its own absolute start and end points.
This is useful when you need to:
- Measure the length of a path
- Sample points along a path
- Transform individual segments
- Compute bounding boxes
Closing commands (Z) become explicit straight Line segments back to the
stroke's starting point, so a closed shape measures and samples like the
complete outline you see on screen.
Convert geometric segments back into paths. Consecutive segments that share endpoints become one continuous pen stroke. Wherever a segment starts somewhere other than where the previous one ended, the pen is lifted and a new stroke begins there.
fromSegments
    [ Line { from = ( 10, 10 ), to = ( 90, 10 ) }
    , Line { from = ( 90, 10 ), to = ( 90, 90 ) }
    ]
--> [ M ( 10, 10 ) [ L ( 90, 10 ), L ( 90, 90 ) ] ]


-- A discontinuity creates a new subpath:
fromSegments
    [ Line { from = ( 0, 0 ), to = ( 50, 0 ) }
    , Line
        { from = ( 100, 100 )
        , to = ( 150, 100 )
        }
    ]
--> [ M ( 0, 0 ) [ L ( 50, 0 ) ]
--> , M ( 100, 100 ) [ L ( 150, 100 ) ]
--> ]
Measurement and Sampling
The total length of a path, that is, how far the pen travels while drawing it. Straight lines are measured exactly; curves are measured approximately by sampling points along them.
pathLength [ M ( 0, 0 ) [ L ( 100, 0 ) ] ] --> 100


-- a 3-4-5 triangle:
pathLength [ M ( 0, 0 ) [ L ( 30, 40 ) ] ] --> 50Find the point you would reach by tracing the path partway along its length. The second argument says how far to go: 0.0 is the very start of the path, 1.0 is the very end, and 0.5 is the point exactly halfway along, measured by drawn distance. Useful for placing labels or markers along a line, or for animating something traveling along a path.
interpolate [ M ( 0, 0 ) [ L ( 100, 0 ) ] ] 0.5
--> ( 50, 0 )
Rendering
Render a single path to the compact text notation that SVG uses for
path data (the d attribute), for example "M10 10L90 10Z". You rarely need
this yourself, since Evg.path accepts Path values directly, but it is
useful for interoperating with other libraries or debugging. To render a
list of paths, use List.map toString >> String.join "".
A single stroke of the pen: first lift the pen and put it down somewhere, then draw a sequence of lines and curves from there.
M point segmentsplaces the pen at an absolute position, then drawsMRelative offset segmentsplaces the pen relative to wherever the previous stroke ended, then drawsPassing several
Pathvalues toEvg.pathdraws them all as one shape. Since the pen lifts between strokes, the pieces can be disconnected, and a piece drawn inside another one cuts a hole in it. That is how you draw a donut: one stroke for the outer circle, another for the inner one.